Clinicopathological Features of Upper Third Gastric Cancer during a 21-Year Period (Single Center Analysis)
- PMID: 22076188
- PMCID: PMC3204506
- DOI: 10.5230/jgc.2010.10.4.212
Clinicopathological Features of Upper Third Gastric Cancer during a 21-Year Period (Single Center Analysis)
Abstract
Purpose: The aim of this study was to determine proportions of upper third gastric cancer (UTG) among all gastric cancers and analyze clinicopathological features of the disease.
Materials and methods: The medical records of 12,300 patients who underwent gastric surgery between 1986 and 2006 at Seoul National University Hospital (SNUH) were retrospectively reviewed. Clinicopathological features of 1,260 patients with UTG and 9,929 patients with middle or lower third gastric cancer (MLG) were compared, and annual proportions of UTG were evaluated.
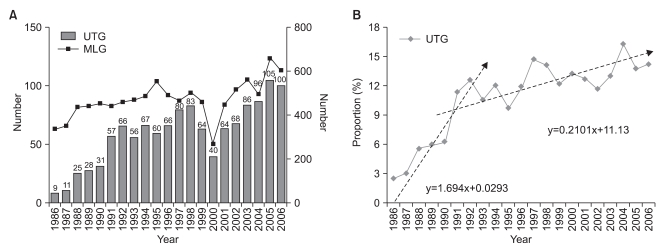
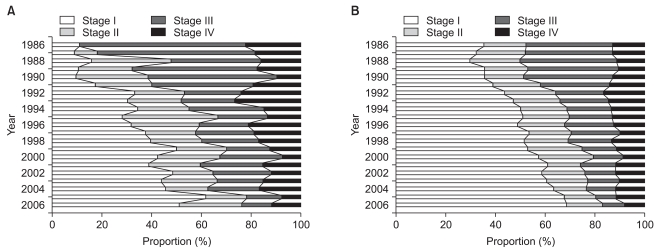
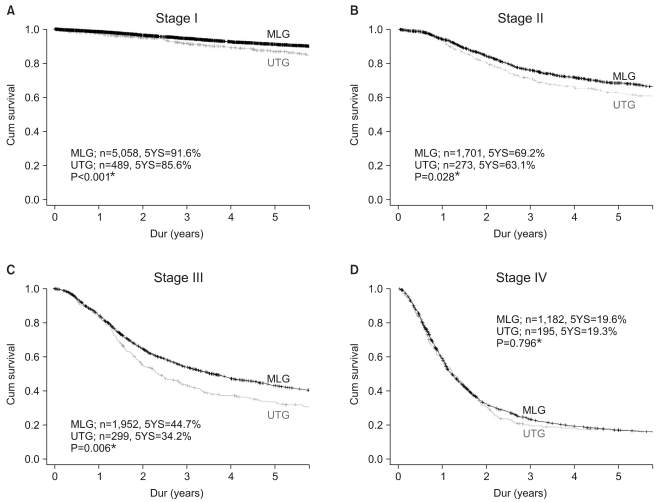
Results: The proportion of patients with UTG rapidly increased from 2.6% in 1986 to 12.5% in 1992. However, linear regression analysis showed that the rate of increase was reduced (0.21%/year) after 1992 (12.5% to 14.2% from 1992 to 2006). Compared with the MLG group, the UTG group had a lower proportion of (22.3% vs. 39.7%, P<0.001) and a greater proportion of stage III/IV disease (39.4% vs. 31.7%, P<0.001). The UTG group also had larger tumors than the MLG group in stages I/II and III (3.5 cm/5.3 cm/6.5 cm vs. 3.2 cm/5.0 cm/5.8 cm, P=0.020/0.028 /<0.001), a higher proportion of undifferentiated cancer (63.1% vs. 53.7%, P<0.001), and less intestinal Lauren's type (38.8% vs. 47.4%, P<0.001). The 5-year survival rate of the UTG group was significantly lower than that of the MLG group in stages I/II and III (85.6%/63.1%/34.2% vs. 91.6%/ 69.2%/44.7%, P<0.001/0.028/0.006).
Conclusions: The proportion of UTGs has increased over the last two decades at SNUH, but the rate of increase has been greatly reduced since 1992. The UTG group showed a poorer prognosis compared with the MLG group in stages I/II and III.
Keywords: Gastric cardia; Gastric fundus; Incidence; Prognoisis; Stomach neoplasms.
Figures
Similar articles
-
Shorter Survival of Patients with Upper-Third Gastric Cancer Preoperatively Diagnosed as Stage IA Compared with Those with Middle to Lower Lesions.Ann Surg Oncol. 2020 Jan;27(1):276-283. doi: 10.1245/s10434-019-07782-1. Epub 2019 Sep 9. Ann Surg Oncol. 2020. PMID: 31502022
-
Comparison of the Prognosis of Upper-Third Gastric Cancer With That of Middle and Lower-Third Gastric Cancer.J Gastric Cancer. 2024 Apr;24(2):159-171. doi: 10.5230/jgc.2024.24.e3. J Gastric Cancer. 2024. PMID: 38575509 Free PMC article.
-
[Comparison of clinicopathological features and prognosis between adenocarcinoma of esophagogastric junction and adenocarcinoma of gastric antrum].Zhonghua Wei Chang Wai Ke Za Zhi. 2019 Feb 25;22(2):149-155. Zhonghua Wei Chang Wai Ke Za Zhi. 2019. PMID: 30799537 Chinese.
-
Clinicopathological Features and Prognosis of Mixed-Type T1a Gastric Cancer Based on Lauren's Classification.Ann Surg Oncol. 2016 Dec;23(Suppl 5):784-791. doi: 10.1245/s10434-016-5549-9. Epub 2016 Sep 9. Ann Surg Oncol. 2016. PMID: 27613552
-
[Analysis of clinicopathologic characteristics of gastric cancer patients undergoing gastrectomy based on a single-center gastric cancer database with above 10 000 cases].Zhonghua Wei Chang Wai Ke Za Zhi. 2020 Nov 25;23(11):1051-1058. doi: 10.3760/cma.j.cn.441530-20200117-00031. Zhonghua Wei Chang Wai Ke Za Zhi. 2020. PMID: 33212553 Chinese.
Cited by
-
Analysis of immune status in gastric adenocarcinoma with different infiltrating patterns and origin sites.Front Immunol. 2022 Aug 23;13:978715. doi: 10.3389/fimmu.2022.978715. eCollection 2022. Front Immunol. 2022. PMID: 36081505 Free PMC article.
-
Clinicopathologic characteristics in patients with upper third gastric cancer following radical surgical treatment: A retrospective cohort study.Medicine (Baltimore). 2018 Nov;97(45):e13017. doi: 10.1097/MD.0000000000013017. Medicine (Baltimore). 2018. PMID: 30407293 Free PMC article.
-
Tubulointerstitial nephritis antigen-like 1 from cancer-associated fibroblasts contribute to the progression of diffuse-type gastric cancers through the interaction with integrin β1.J Transl Med. 2024 Feb 14;22(1):154. doi: 10.1186/s12967-024-04963-9. J Transl Med. 2024. PMID: 38355577 Free PMC article.
-
Evaluation of the 7th UICC TNM Staging System of Gastric Cancer.J Gastric Cancer. 2011 Jun;11(2):78-85. doi: 10.5230/jgc.2011.11.2.78. Epub 2011 Jun 30. J Gastric Cancer. 2011. PMID: 22076207 Free PMC article.
-
Comparison on Clinicopathological Features and Prognosis Between Esophagogastric Junctional Adenocarcinoma (Siewert II/III Types) and Distal Gastric Adenocarcinoma: Retrospective Cohort Study, a Single Institution, High Volume Experience in China.Medicine (Baltimore). 2015 Aug;94(34):e1386. doi: 10.1097/MD.0000000000001386. Medicine (Baltimore). 2015. PMID: 26313779 Free PMC article.
References
-
- Parkin DM, Bray F, Ferlay J, Pisani P. Global cancer statistics, 2002. CA Cancer J Clin. 2005;55:74–108. - PubMed
-
- Hassan HA, Sharma VK, Raufman JP. Changing trends in gastric carcinoma at a university medical center: a twelve-year retrospective analysis. J Clin Gastroenterol. 2001;32:37–40. - PubMed
-
- Blaser MJ, Saito D. Trends in reported adenocarcinomas of the oesophagus and gastric cardia in Japan. Eur J Gastroenterol Hepatol. 2002;14:107–113. - PubMed
-
- Zhou Y, Zhang Z, Zhang Z, Wu J, Ren D, Yan X, et al. A rising trend of gastric cardia cancer in Gansu Province of China. Cancer Lett. 2008;269:18–25. - PubMed
-
- Ryu KW, Kim CS, Goo BH. Clinicopathologic characteristics of and prognosis for proximal gastric carcinomas. J Korean Surg Soc. 2000;59:223–228.
LinkOut - more resources
Full Text Sources
Miscellaneous