. 2011;1(2):147-57.
doi: 10.1089/brain.2011.0007.

Connectivity gradients between the default mode and attention control networks

Affiliations

Connectivity gradients between the default mode and attention control networks

Jeffrey S Anderson et al. Brain Connect. 2011.

Abstract

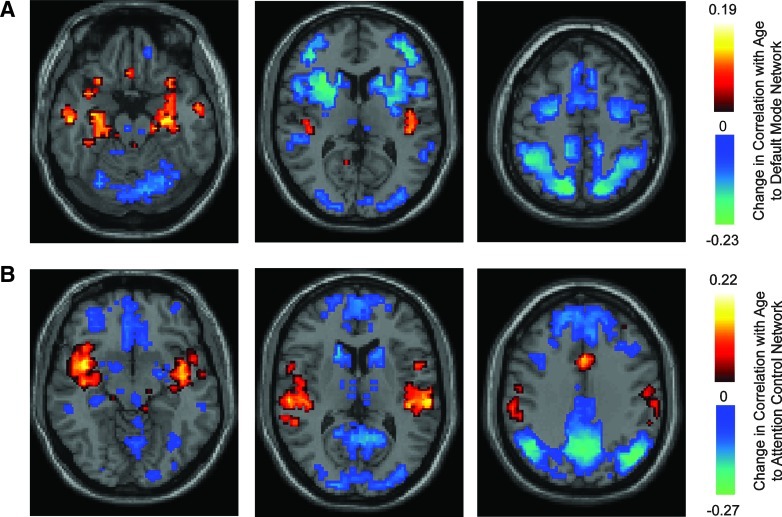
Functional imaging studies have shown reduced activity within the default mode network during attention-demanding tasks. The network circuitry underlying this suppression remains unclear. Proposed hypotheses include an attentional switch in the right anterior insula and reciprocal inhibition between the default mode and attention control networks. We analyzed resting state blood oxygen level dependent (BOLD) data from 1278 subjects from 26 sites and constructed whole-brain maps of functional connectivity between 7266 regions of interest (ROIs) covering the gray matter at ~5 mm resolution. ROIs belonging to the default mode network and attention control network were identified based on correlation to six published seed locations. Spatial heterogeneity of correlation between the default mode and attention control networks was observed, with smoothly varying gradients in every hub of both networks that ranged smoothly from weakly but significantly anticorrelated to positively correlated. Such gradients were reproduced in 3 separate groups of subjects. Anticorrelated subregions were identified in major hubs of both networks. Between-network connectivity gradients strengthen with age during late adolescence and early adulthood, with associated sharpening of the boundaries of the default mode network, integration of the insula and cingulate with frontoparietal attentional regions, and decreasing correlation between the default mode and attention control networks with age.

Keywords: anticorrelations; attention control network; default mode network; fcMRI; functional connectivity; resting state; task positive network.


Figures

FIG. 1.
FIG. 1.
Distribution of ages from 1278 subjects used in the analysis, grouped into bins of 1 year, with a range from 7 to 35 years.
FIG. 2.
FIG. 2.
Identification of default mode and attention control networks. (A) Distribution of correlation to 6 seed regions of interest (ROIs; 3 for each network) for 7266 ROIs covering the gray matter. (B) Boundaries of the default mode (blue) and attention control (red) networks used for subsequent analyses. Images are in radiologic format, with patient left on image right. Slice locations (top left to bottom right): z=55, 30, 10, −10.
FIG. 3.
FIG. 3.
Connectivity gradients between default mode and attention control networks. (A) Mean correlation for each ROI of the default mode network to ROIs comprising the attention control network. Color scale is expressed as Fisher-transformed correlation. Results are shown separately for three groups of subjects. (B) Mean correlation for each ROI of the attention control network to the default mode network. Images are in radiologic format, with patient left on image right. Slice locations by row: z=35, y=−3, z=55, z=48, z=10.
FIG. 4.
FIG. 4.
Significant anticorrelations between networks. Twelve ROIs were identified as having lowest correlation with the opposite network among major hubs. Time series from these ROIs were correlated with those from every other ROI in the brain, and significantly anticorrelated regions are shown above, thresholded at acceptable false discovery rate q<0.05. Color scale shows T-score for anticorrelation across subjects. Posterior cingulate and medial prefrontal examples were from the left ROIs, and were almost indistinguishable from results from the right-sided ROIs from the same hubs. Images are in radiologic format, with patient left on image right. Slice locations by column: z=35, z=−15, z=45, z=10.
FIG. 5.
FIG. 5.
Significant changes in correlation with age. (A) Significant correlation between age and correlation of each of 7266 ROIs with the default mode network, with acceptable false discovery rate q<0.05. (B) Significant correlation between age and correlation of each ROI to the attention control network. Color bars show units expressed as correlation (r), with only significant ROIs colored after multiple comparison correction. Negative values indicate decreasing correlation with age, and positive values increasing correlation with age. Slice locations: (top row) z=−20, 10, 55 (bottom row) z=−10, 10, 35.
FIG. 6.
FIG. 6.
Change in within-network and between network correlation with age. (A) Scatter plot of ROIs of the default mode network comparing mean correlation to the default mode network (x-axis) to change in default mode network correlation with age. (B) Mean correlation of default mode network ROIs to the default mode network versus change in correlation with age to the attention control network. (C) Mean correlation of attention control network ROIs versus change in correlation to attention control network with age. Insula and anterior cingulate ROIs are shown in red and blue, respectively. (D) Mean correlation of attention control network ROIs to the default mode network versus change in correlation with age to the attention control network.

References

    1. Anderson JS. Origin of synchronized low-frequency blood oxygen level-dependent fluctuations in the primary visual cortex. AJNR Am J Neuroradiol. 2008;29:1722–1729. - PMC - PubMed
    1. Anderson JS. Dhatt HS. Ferguson MA. Lopez-Larson M. Schrock L. House P. Yurgelun-Todd D. Functional connectivity targeting for deep brain stimulation in essential tremor. AJNR Am J Neuroradiol. 2011a. (In press). - PMC - PubMed
    1. Anderson JS. Druzgal TJ. Lopez-Larson M. Jeong EK. Desai K. Yurgelun-Todd D. Network anticorrelations, global regression, and phase-shifted soft tissue correction. Hum Brain Mapp. 2011b;32:919–934. - PMC - PubMed
    1. Anderson JS. Ferguson MA. Lopez-Larson M. Yurgelun-Todd D. Topographic maps of multisensory attention. Proc Natl Acad Sci U S A. 2010;107:20110–20114. - PMC - PubMed
    1. Anderson JS. Ferguson MA. Lopez-Larson M. Yurgelun-Todd D. Reproducibility of functional connectivity measurements in single subjects. AJNR Am J Neuroradiol. 2011c;32:548–555. - PMC - PubMed

Publication types