

Refinement of the associations between risk of colorectal cancer and polymorphisms on chromosomes 1q41 and 12q13.13
- PMID: 22076443
- PMCID: PMC3263985
- DOI: 10.1093/hmg/ddr523
Refinement of the associations between risk of colorectal cancer and polymorphisms on chromosomes 1q41 and 12q13.13
Abstract
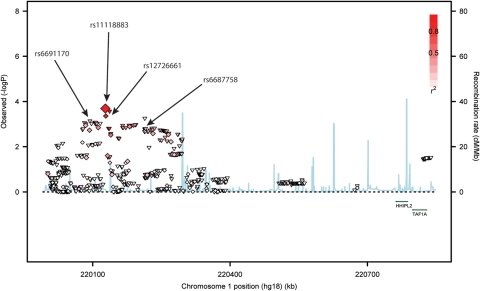
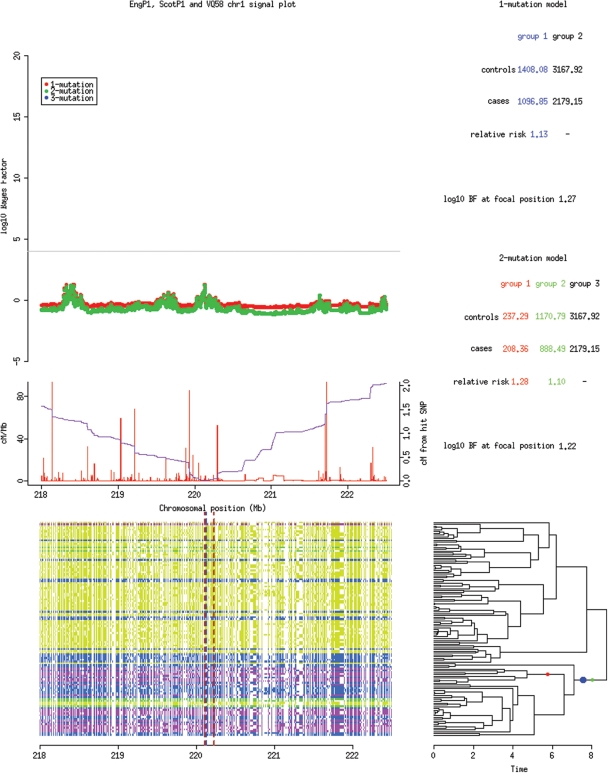
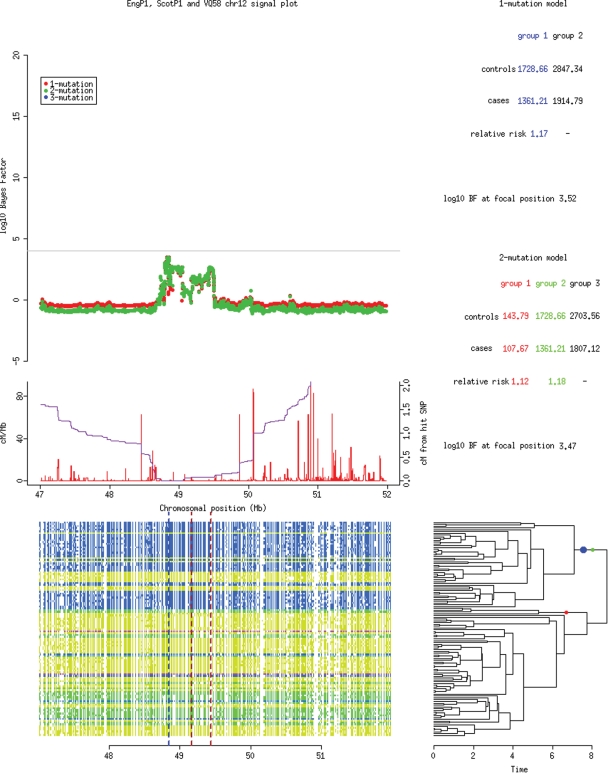
In genome-wide association studies (GWASs) of colorectal cancer, we have identified two genomic regions in which pairs of tagging-single nucleotide polymorphisms (tagSNPs) are associated with disease; these comprise chromosomes 1q41 (rs6691170, rs6687758) and 12q13.13 (rs7163702, rs11169552). We investigated these regions further, aiming to determine whether they contain more than one independent association signal and/or to identify the SNPs most strongly associated with disease. Genotyping of additional sample sets at the original tagSNPs showed that, for both regions, the two tagSNPs were unlikely to identify a single haplotype on which the functional variation lay. Conversely, one of the pair of SNPs did not fully capture the association signal in each region. We therefore undertook more detailed analyses, using imputation, logistic regression, genealogical analysis using the GENECLUSTER program and haplotype analysis. In the 1q41 region, the SNP rs11118883 emerged as a strong candidate based on all these analyses, sufficient to account for the signals at both rs6691170 and rs6687758. rs11118883 lies within a region with strong evidence of transcriptional regulatory activity and has been associated with expression of PDGFRB mRNA. For 12q13.13, a complex situation was found: SNP rs7972465 showed stronger association than either rs11169552 or rs7136702, and GENECLUSTER found no good evidence for a two-SNP model. However, logistic regression and haplotype analyses supported a two-SNP model, in which a signal at the SNP rs706793 was added to that at rs11169552. Post-GWAS fine-mapping studies are challenging, but the use of multiple tools can assist in identifying candidate functional variants in at least some cases.
Figures


References
-
- Houlston R.S., Cheadle J., Dobbins S.E., Tenesa A., Jones A.M., Howarth K., Spain S.L., Broderick P., Domingo E., Farrington S., et al. Meta-analysis of three genome-wide association studies identifies susceptibility loci for colorectal cancer at 1q41, 3q26.2, 12q13.13 and 20q13.33. Nat. Genet. 2010;42:973–977. doi:10.1038/ng.670. - DOI - PMC - PubMed
-
- Tomlinson I., Carvajal-Carmona L., Dobbins S., Tenesa A., Jones A., Howarth K., Palles C., Broderick P., Jaeger E., Farrington S., et al. Multiple common susceptibility variants near BMP pathway loci GREM1, BMP4, and BMP2 explain part of the missing heritability of colorectal cancer. PLoS Genet. 2011;7:e1002105. doi:10.1371/journal.pgen.1002105. - DOI - PMC - PubMed
-
- Hemminki K., Forsti A., Houlston R., Bermejo J.L. Searching for the missing heritability of complex diseases. Hum. Mutat. 2011;32:259–262. doi:10.1002/humu.21392. - DOI - PubMed
-
- Gamazon E.R., Zhang W., Konkashbaev A., Duan S., Kistner E.O., Nicolae D.L., Dolan M.E., Cox N.J. SCAN: SNP and copy number annotation. Bioinformatics. 2010;26:259–262. doi:10.1093/bioinformatics/btp644. - DOI - PMC - PubMed
-
- Yang T.P., Beazley C., Montgomery S.B., Dimas A.S., Gutierrez-Arcelus M., Stranger B.E., Deloukas P., Dermitzakis E.T. Genevar: a database and Java application for the analysis and visualization of SNP-gene associations in eQTL studies. Bioinformatics. 2010;26:2474–2476. doi:10.1093/bioinformatics/btq452. - DOI - PMC - PubMed
Publication types
MeSH terms
Grants and funding
LinkOut - more resources
Full Text Sources
Other Literature Sources
Medical
Miscellaneous
