Comparative Study
. 2011 Dec 20;52(13):9581-90.
doi: 10.1167/iovs.11-8554.

Transition zones between healthy and diseased retina in choroideremia (CHM) and Stargardt disease (STGD) as compared to retinitis pigmentosa (RP)

Affiliations
Comparative Study

Transition zones between healthy and diseased retina in choroideremia (CHM) and Stargardt disease (STGD) as compared to retinitis pigmentosa (RP)

Margot A Lazow et al. Invest Ophthalmol Vis Sci. .

Abstract

Purpose: To describe the structural changes across the transition zone (TZ) in choroideremia (CHM) and Stargardt disease (STGD) and to compare these to the TZ in retinitis pigmentosa (RP).

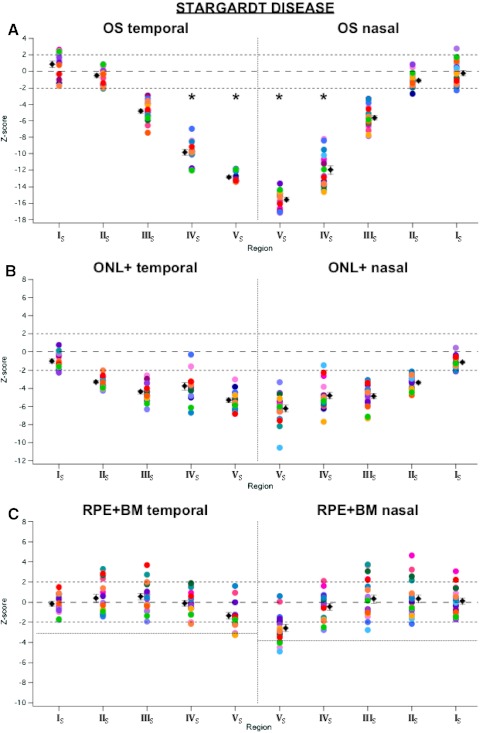
Methods: Frequency-domain (Fd)OCT line scans were obtained from seven patients with CHM, 20 with STGD, and 12 with RP and compared with those of 30 previously studied controls. A computer-aided manual segmentation procedure was used to determine the thicknesses of the outer segment (OS) layer, the outer nuclear layer plus outer plexiform layer (ONL+), the retinal pigment epithelium plus Bruch's membrane (RPE+BM), and the outer retina (OR).

Results: The TZ, while consistent within patient groups, showed differences across disease groups. In particular, (1) OS loss occurred before ONL+ loss in CHM and RP, whereas ONL+ loss occurred before OS loss in STGD; (2) ONL+ was preserved over a wider region of the retina in CHM than in RP; (3) RPE+BM remained normal across the RP TZ, but was typically thinned in CHM. In some CHM patients, it was abnormally thin in regions with normal OS and ONL+ thickness. In STGD, RPE+BM was thinned by the end of the TZ; and (4) the disappearances of the IS/OS and OLM were more abrupt in CHM and STGD than in RP.

Conclusions: On fdOCT scans, patients with RP, CHM, and STGD all have a TZ between relatively healthy and severely affected retina. The patterns of changes in the receptor layers are similar within a disease category, but different across categories. The findings suggest that the pattern of progression of each disease is distinct and may offer clues for strategies in the development of future therapies.


Figures

Figure 1.
Figure 1.
(A) FdOCT scan of the horizontal meridian of a normal retina. (B) Same scan as in (A), but showing the segmented borders and thicknesses derived from them.
Figure 2.
Figure 2.
(A) FdOCT scan of the horizontal meridian of P1 with CHM. Red arrows: the locations at which the OPL formed an interlaminar bridge; yellow arrow: the location of a tubular structure., (B) Same scan as in (A), but showing the segmented borders. Blue circles: the points at which the OLM disappeared. (C) OS thickness profiles across the retina in the patient in (A) (dark blue trace) and the mean (bold black trace) and ±2 SD (thin black traces) of the 30 controls. Purple circles: the locations at which the OS thickness fell below the 95% CI; red circles: points at which the OS thickness approached 0. (D) ONL+ thickness profiles across the retina in the patient in (A) (light blue trace) and for the mean and ±2 SD of the 30 controls. (E) RPE+BM thickness profiles across the retina in the patient in (A) (pink trace) and for the mean and ±2 SD of the 30 controls. (F) OR thickness profiles across the retina in the patient in (A) (green trace) and for the mean and ±2 SD of the 30 controls. Orange circles: the locations at which the OR thickness approached an asymptotic level. Colored bars, bottom: the extent of each region; black arrows: the direction of disease progression.
Figure 3.
Figure 3.
(A) Colored symbols: the OS layer thicknesses in the patients with CHM, shown as z-scores (the number of standard deviations above or below the mean of the controls), which were obtained by relating the thickness of each region of each hemifield of each patient to the distribution of the 30 control thicknesses for the same region width. (◆) The mean ±1 SE of the patients. Dashed horizontal lines: controls' mean and ±2 SD (CI boundaries); (*) regions in which the OS layer was not present. (B) Same as in (A), but for ONL+ thickness. (C) Same as in (A), but for RPE+BM thickness. Solid lines: the z-score equivalent of the minRPE+BM thickness found in the patients with severe RP.
Figure 4.
Figure 4.
(A) FdOCT scan of the horizontal meridian of a patient with STGD. Red arrows: pigment migration. (B) Same scan as in (A), but showing the segmented borders. Blue circles: the locations at which the OLM disappeared. (C) OS thickness profiles across the retina in the patient in (A) (dark blue trace) and for the mean (bold black trace) and ±2 SD (thin black trace) of the 30 controls. Purple circles: the locations at which the OS thickness fell below the 95% CI; red circles: the locations at which OS thickness approached 0. (D) ONL+ thickness profiles across the retina in the patient in (A) (light blue trace) and for the mean and ±2 SD of the 30 controls. Green circles: the locations at which ONL+ thickness fell below the 95% CI. (E) RPE+BM thickness profiles the across retina in the patient in (A) (pink trace) and for the mean and ±2 SD of the 30 controls. Colored bars, bottom: the extent of each region; black arrows: the direction of disease progression. (All data in this figure are presented as if from a right eye.)
Figure 5.
Figure 5.
Same as in Figure 3, but for patients with STGD.
Figure 6.
Figure 6.
Same as in Figure 3, but for 12 patients with RP (who had Humphrey visual field diameters ≥10°, foveal sensitivities ≥32 dB, and BCVAs between 20/15 and 20/50).
Figure 7.
Figure 7.
(A) Temporal hemifield of the CHM patient's scan in Figure 2A. (B) Temporal hemifield of the STGD patient's scan in Figure 4A. (C) Temporal hemifield of an RP patient's scan. Red arrows: the location where the IS/OS line disappears; blue arrows: the location where the OLM disappears.

Similar articles

Cited by

References

    1. Jacobson SG, Aleman TS, Sumaroka A, et al. Disease boundaries in the retina of patients with Usher syndrome caused by MYO7A gene mutations. Invest Ophthalmol Vis Sci. 2009;50:1886–1894 - PubMed
    1. Hood DC, Lazow MA, Locke KG, Greenstein VC, Birch DG. The transition zone between healthy and diseased retina in patients with retinitis pigmentosa. Invest Ophthalmol Vis Sci. 2011;52:101–108 - PMC - PubMed
    1. Chen Y, Ratnam K, Sundquist SM, et al. Cone photoreceptor abnormalities correlate with vision loss in patients with Stargardt disease. Invest Ophthalmol Vis Sci. 2011;52:3281–3292 - PMC - PubMed
    1. Jacobson SG, Cideciyan AV, Sumaroka A, et al. Remodeling of the human retina in choroideremia: Rab escort protein 1 (REP-1) mutations. Invest Ophthalmol Vis Sci. 2006;47:4113–4120 - PubMed
    1. Lee TK, McTaggart KE, Sleving PA, et al. Clinical diagnoses that overlap with choroideremia. Can J Ophthalmol. 2003;38:364–372 - PubMed

Publication types