

Alliance for aging research AD biomarkers work group: structural MRI
- PMID: 22078173
- PMCID: PMC3661287
- DOI: 10.1016/j.neurobiolaging.2011.09.011
Alliance for aging research AD biomarkers work group: structural MRI
Abstract
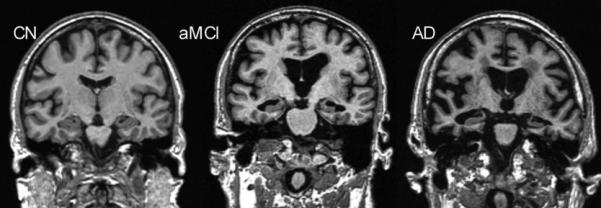
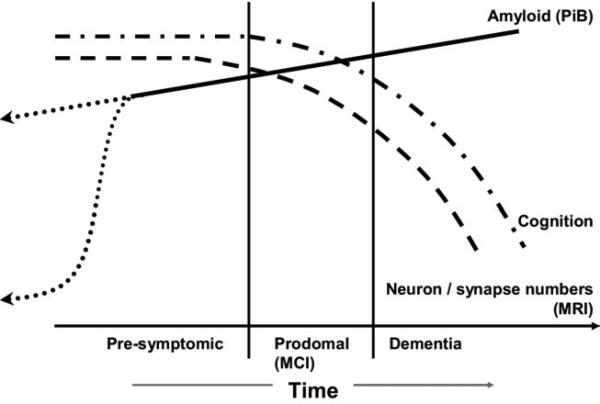
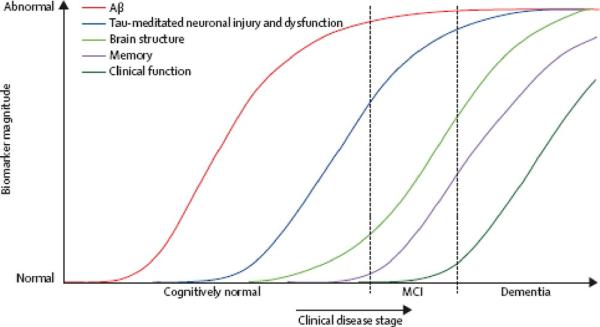
Biomarkers of Alzheimer's disease (AD) are increasingly important. All modern AD therapeutic trials employ AD biomarkers in some capacity. In addition, AD biomarkers are an essential component of recently updated diagnostic criteria for AD from the National Institute on Aging--Alzheimer's Association. Biomarkers serve as proxies for specific pathophysiological features of disease. The 5 most well established AD biomarkers include both brain imaging and cerebrospinal fluid (CSF) measures--cerebrospinal fluid Abeta and tau, amyloid positron emission tomography (PET), fluorodeoxyglucose (FDG) positron emission tomography, and structural magnetic resonance imaging (MRI). This article reviews evidence supporting the position that MRI is a biomarker of neurodegenerative atrophy. Topics covered include methods of extracting quantitative and semiquantitative information from structural MRI; imaging-autopsy correlation; and evidence supporting diagnostic and prognostic value of MRI measures. Finally, the place of MRI in a hypothetical model of temporal ordering of AD biomarkers is reviewed.
Copyright © 2011. Published by Elsevier Inc.
Figures
References
-
- Alexander GE, Moeller JR. Application of the scaled subprofile model to functional imaging in neuropsychiatric disorders: A principal component approach to modeling regional patterns of brain function in disease. Human Brain Mapping. 1994;2:79–94.
-
- Ashburner J, Friston KJ. Voxel-based morphometry--the methods. Neuroimage. 2000;11(6 Pt 1):805–21. - PubMed
-
- Bobinski M, de Leon MJ, Wegiel J, Desanti S, Convit A, Saint Louis LA, Rusinek H, Wisniewski HM. The histological validation of post mortem magnetic resonance imaging-determined hippocampal volume in Alzheimer's disease. Neuroscience. 2000;95(3):721–5. - PubMed
-
- Braak H, Braak E. Neuropathological stageing of Alzheimer-related changes. Acta Neuropathol. 1991;82(4):239–59. - PubMed
Publication types
MeSH terms
Substances
Grants and funding
LinkOut - more resources
Full Text Sources
Other Literature Sources
Medical
