Review
. 2011 Nov 9;19(11):1549-61.
doi: 10.1016/j.str.2011.10.009.

Toward the fourth dimension of membrane protein structure: insight into dynamics from spin-labeling EPR spectroscopy

Affiliations
Review

Toward the fourth dimension of membrane protein structure: insight into dynamics from spin-labeling EPR spectroscopy

Hassane S McHaourab et al. Structure. .

Abstract

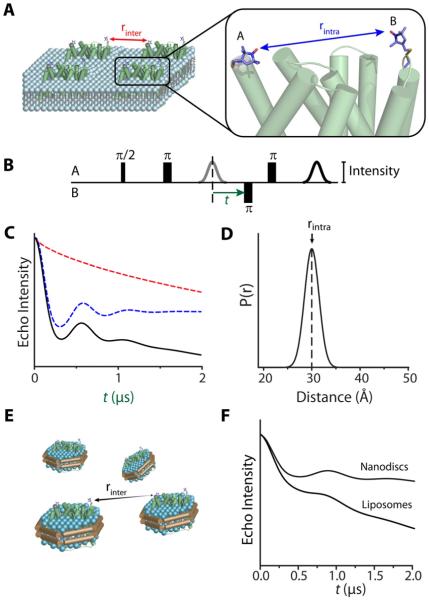
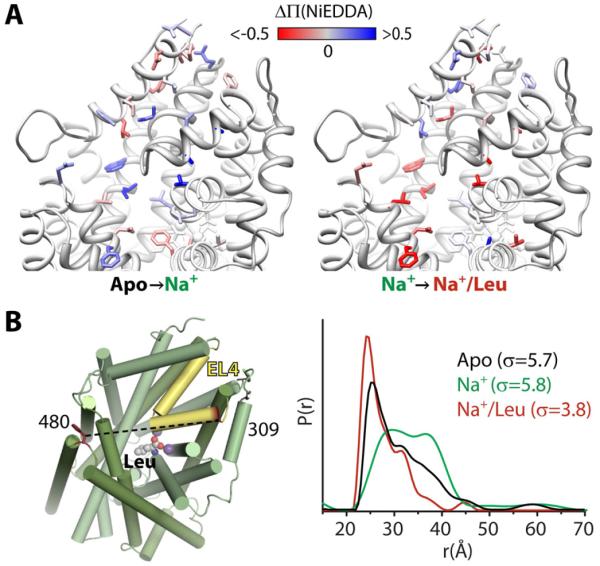
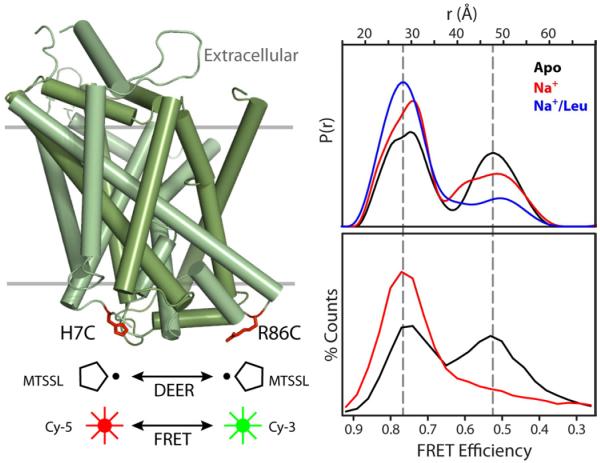
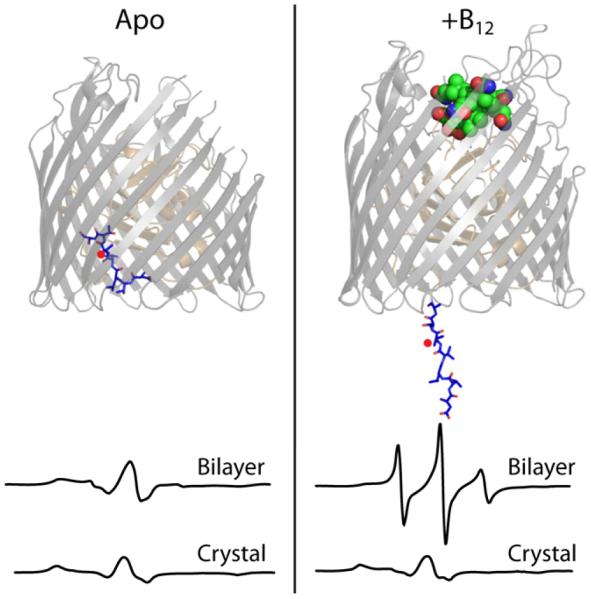
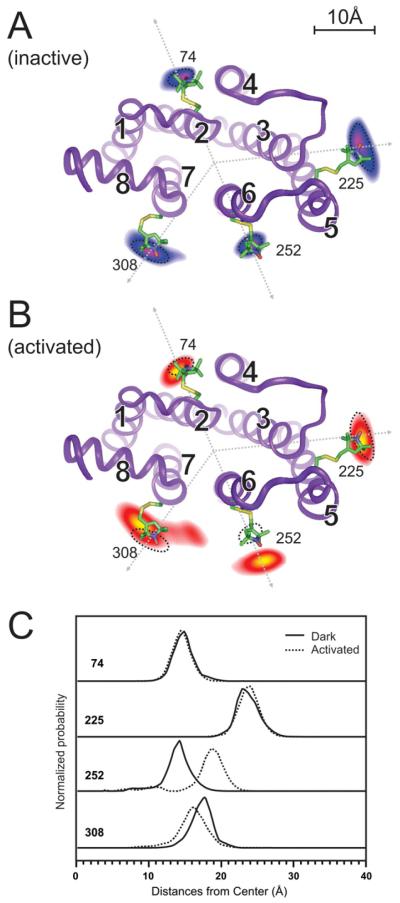
Trapping membrane proteins in the confines of a crystal lattice obscures dynamic modes essential for interconversion between multiple conformations in the functional cycle. Moreover, lattice forces could conspire with detergent solubilization to stabilize a minor conformer in an ensemble thus confounding mechanistic interpretation. Spin labeling in conjunction with electron paramagnetic resonance (EPR) spectroscopy offers an exquisite window into membrane protein dynamics in the native-like environment of a lipid bilayer. Systematic application of spin labeling and EPR identifies sequence-specific secondary structures, defines their topology and their packing in the tertiary fold. Long range distance measurements (60 Å-80 Å) between pairs of spin labels enable quantitative analysis of equilibrium dynamics and triggered conformational changes. This review highlights the contribution of spin labeling to bridging structure and mechanism. Efforts to develop methods for determining structures from EPR restraints and to increase sensitivity and throughput promise to expand spin labeling applications in membrane protein structural biology.


Figures

Figure 1
Figure 1. From raw DEER signals to the distance distribution
(A) A pair of spin labels (A and B) is depicted on the surface of a membrane protein embedded in a liposome. The spin echo decay has contributions from dipolar coupling between spins on the same protein molecule (rintra; blue arrow) and from intermolecular dipolar coupling between spins on neighboring molecules (rinter; red arrow). (B) Typical four-pulse DEER sequence. An inversion pulse is applied to spin B at time t while observing the echo of spin A. (C) Spin echo intensity decays as time t is increased. The observed signal (black) is the result of modulation of echo intensities from intramolecular coupling (blue) and intermolecular coupling, or background decay (red). The decays are based on simulations using the DEER2010 package (Jeschke et al., 2006). (D) The distribution of distances between spins A and B is derived from the spin echo decay in (C). (E) Reconstitution in Nanodiscs lowers the effective concentration of proteins by allowing proteins to occupy three dimensions while retaining the lipid bilayer environment. (F) Increasing the intermolecular distance between spins by using Nanodiscs reduces the contribution of the background decay, relative to that of proteoliposomes, to the spin echo decay.
Figure 2
Figure 2. Empirically-determined intrinsic width of distance distributions
(A) Structure of T4L highlighting representative pairs used for distance measurements between spin labels. (B) Sigma (σ) values calculated from experimental distance distributions from T4L are shown as a histogram binned at intervals of 0.5Å.
Figure 3
Figure 3. DEER detection of triggered conformational changes
(A) Hypothetical motion of a transmembrane helix (orange) during the transition from State A to State B alters the average distance (rav, arrows) between spin labels. The rotameric ensemble of each label, represented by white sticks, was generated from a rotamer library using the program MMM (Polyhach et al., 2011). (B) If states A and B are distinct conformers of different energies, the conformational shift will manifest primarily as a change in rav, evident as an increased period of the spin echo decay (inset). (C) If states A and B represent two conformations present in equilibrium, altering the biochemical conditions will alter the contribution of each distinct conformation (dashed curves) to the distance distribution (green curve).
Figure 4
Figure 4. ATP-driven alternating access in MsbA: large distance changes between two distinct conformers
(A) Spin label accessibility (Π) to NiEDDA was probed at 201 positions (spheres) on TMs 2-6. The change in accessibility (ΔΠ = ΠADP+Vi − Πapo) between the apo and ADP+Vi bound states is depicted by a gradient from red (decreased) to white (no change) to blue (increased) and mapped onto the apo MsbA structure (NBDs and helices not probed are removed for clarity). Inset: Plot of Π values for TM3 residues 136-165 in the apo (black) and ADP+Vi bound (maroon) states. (B) Representative spin label pairs mapped on the apo and AMP-PNP bound structures. The distance distribution of each pair measured by DEER in the absence of nucleotide (black) or the presence of ADP+Vi (maroon).
Figure 5
Figure 5. Shifts in conformational equilibria: Na+ and Leu binding to LeuT
(A) Spin label accessibility (Π) to NiEDDA was probed at positions (side chains shown) on the extracellular side. The change in accessibility (ΔΠ) between the apo and Na+-bound states or the Na+- and Na+/Leu-bound states is depicted by a gradient from red (decreased) to white (no change) to blue (increased) and mapped onto the Na+/Leu-bound structure of LeuT. (B) Distance changes between spin labels at positions 309 in EL4 (yellow) and 480 reveal changes in the conformational ensemble in the apo (black), Na+-bound (green), and Na+/Leu-bound (red) states.
Figure 6
Figure 6. Conformational fluctuations of LeuT intracellular side revealed by DEER and FRET
Cys at positions 7 and 86 on the intracellular side of LeuT were modified with the Cy-5/Cy-3 FRET pair or with spin labels. Distance distributions from DEER (upper panel) or FRET efficiency histograms from single-molecule FRET (lower panel) were measured in the apo (black), Na+-bound (red), and Na+/Leu-bound (blue) states.
Figure 7
Figure 7. Suppression of flexibility in crystals of BtuB
The structural model of BtuB illustrates the unpacking of the N-terminal Ton box (blue sticks) upon binding of vitamin B12 (green spheres). The CW-EPR spectra of a spin label at position 12 of BtuB (red dot) show that B12 binding markedly increased mobility of this peptide in the context of a lipid bilayer (top spectra) but caused no change in the context of a crystal (bottom spectra).
Figure 8
Figure 8. Structural changes on the cytoplasmic side of Rhodopsin upon activation
(A) The probabilities of spin label locations are shown for sites 74, 225, 252, and 308 as contour maps overlaid on the dark state structure where TM helices are labeled 1-8. The contours are based on a global analysis of 16 different pairwise distance distributions obtained by DEER. (B) The probability contours after light activation clearly show location changes, most prominently an outward movement of site 252. Dotted circles indicate the original locations. (C) Cross-sections of the contours along the dotted lines shown in (A) and (B) show the relative radial movements from the dark state (solid lines) to the activated state (dotted lines). Sites 74 and 225 are static. Site 252 shows a large outward movement while site 308 shows a small inward movement.
Figure 9
Figure 9. Conformational transitions that define activation gating in K+ channels
(A) Location of KcsA cysteine mutations (colored spheres) showing strong dipolar coupling in the closed state (neutral pH). Two diagonally-related subunits (red cylinders) shown for clarity. (B) The semi-quantitative interaction parameter (calculated relative to the under-labeled spectra) illustrates the nature of the conformational motion in TM2. Data is shown for the closed conformation (open bars) and the open conformation (filled bars). The length of the arrow represents the difference in spin-spin interaction parameter between the two conformations. (C) Mechanistic representation of the opening of the internal vestibule during K+ channel gating from the crystal structures of closed KcsA and open MthK, an archaeal K+ channel.
Figure 10
Figure 10. Structure Determination by EPR and Rosetta
Overview of hypothetical de novo modeling of a polytopic membrane protein guided by EPR restraints. Three restraints are highlighted for simplicity but a larger number is required even for a small 3-helix protein. In this scheme, secondary structural element (SSE) definitions inform optimized selection of label pairs for restraints. Analysis of DEER measurements returns distance distributions, which are transformed into probabilistic boundary functions to describe the distance between β-carbons (dCβ) of the label pairs. Restraint violation scores measure model agreement with these functions and guide Monte Carlo modeling trajectories. Selecting for models with both low energy and low restraint violations have been shown to effectively limit model pools to low RMSD models (as shown in the 3D plot). These models proceed to all-atom, high resolution refinement with explicit modeling of the restraints, resulting in a best model.

References

    1. Abramson J, Smirnova I, Kasho V, Verner G, Kaback HR, Iwata S. Structure and mechanism of the lactose permease of Escherichia coli. Science. 2003;301:610–615. - PubMed
    1. Alexander N, Bortolus M, Al-Mestarihi A, Mchaourab H, Meiler J. De novo high-resolution protein structure determination from sparse spin-labeling EPR data. Structure. 2008;16:181–195. - PMC - PubMed
    1. Altenbach C, Froncisz W, Hemker R, Mchaourab H, Hubbell WL. Accessibility of nitroxide side chains: absolute Heisenberg exchange rates from power saturation EPR. Biophys J. 2005;89:2103–2112. - PMC - PubMed
    1. Altenbach C, Kusnetzow AK, Ernst OP, Hofmann KP, Hubbell WL. High-resolution distance mapping in rhodopsin reveals the pattern of helix movement due to activation. Proc Natl Acad Sci U S A. 2008;105:7439–7444. - PMC - PubMed
    1. Altenbach C, Marti T, Khorana HG, Hubbell WL. Transmembrane protein structure: spin labeling of bacteriorhodopsin mutants. Science. 1990;248:1088–1092. - PubMed

Publication types

Substances

LinkOut - more resources