

IL-4 acts as a potent stimulator of IFN-γ expression in CD8+ T cells through STAT6-dependent and independent induction of Eomesodermin and T-bet
- PMID: 22078635
- PMCID: PMC3246089
- DOI: 10.1016/j.cyto.2011.10.006
IL-4 acts as a potent stimulator of IFN-γ expression in CD8+ T cells through STAT6-dependent and independent induction of Eomesodermin and T-bet
Abstract
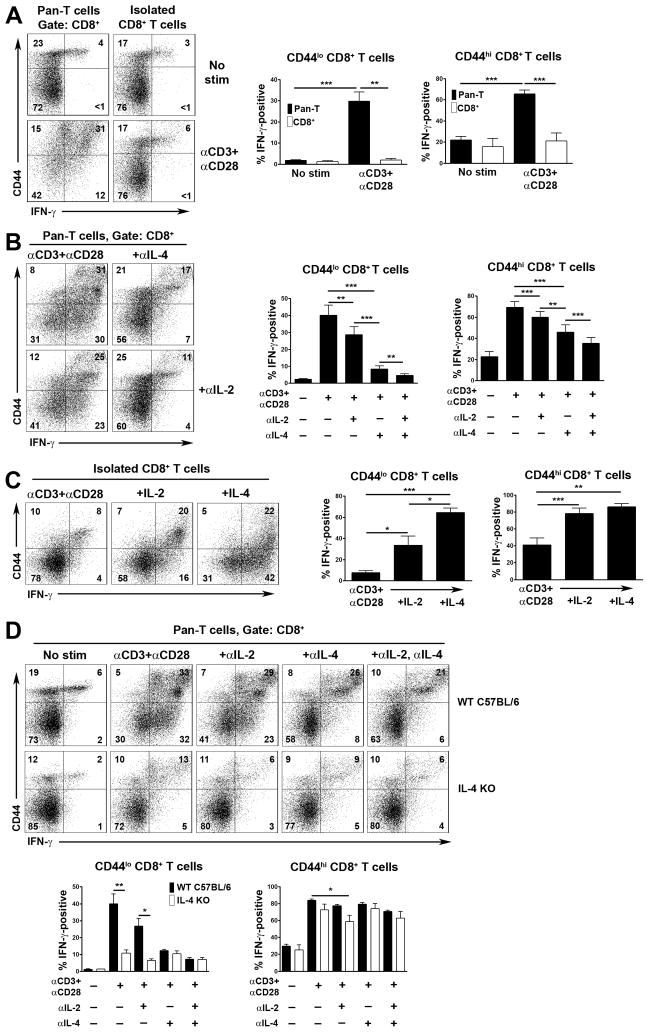
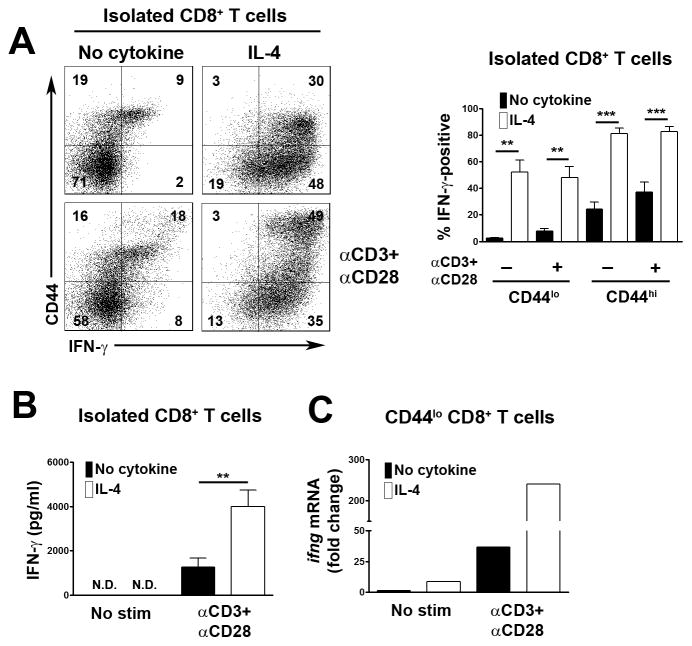
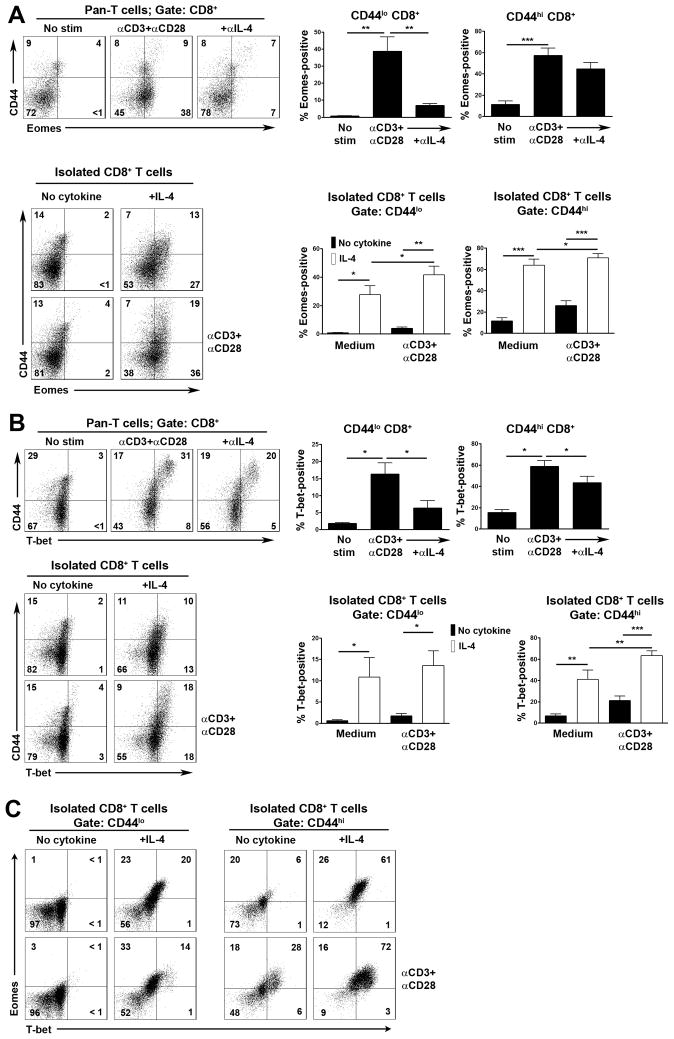
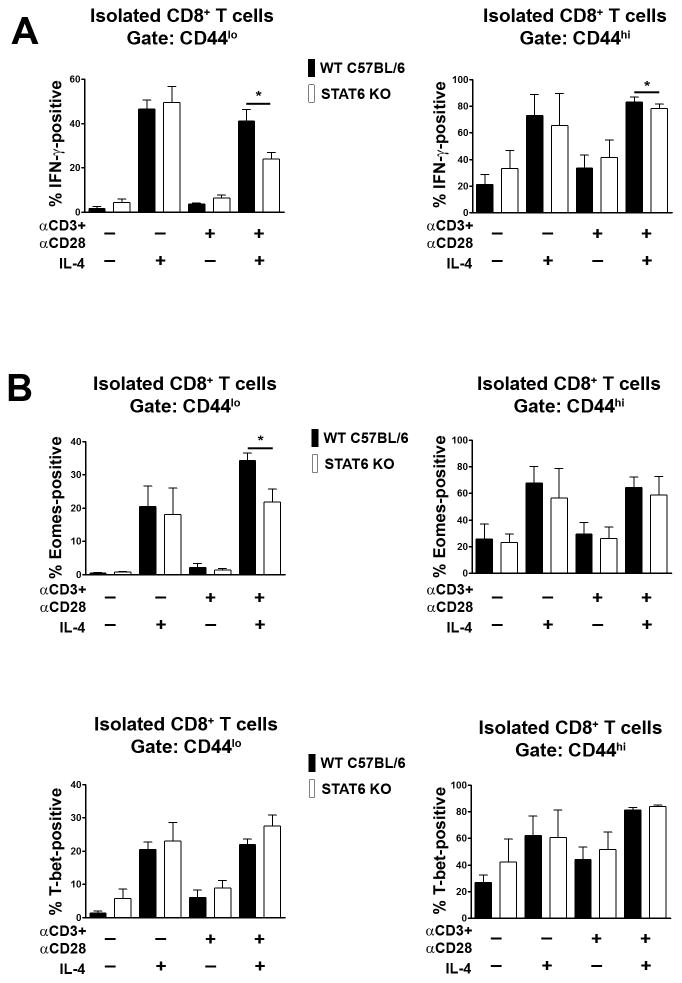
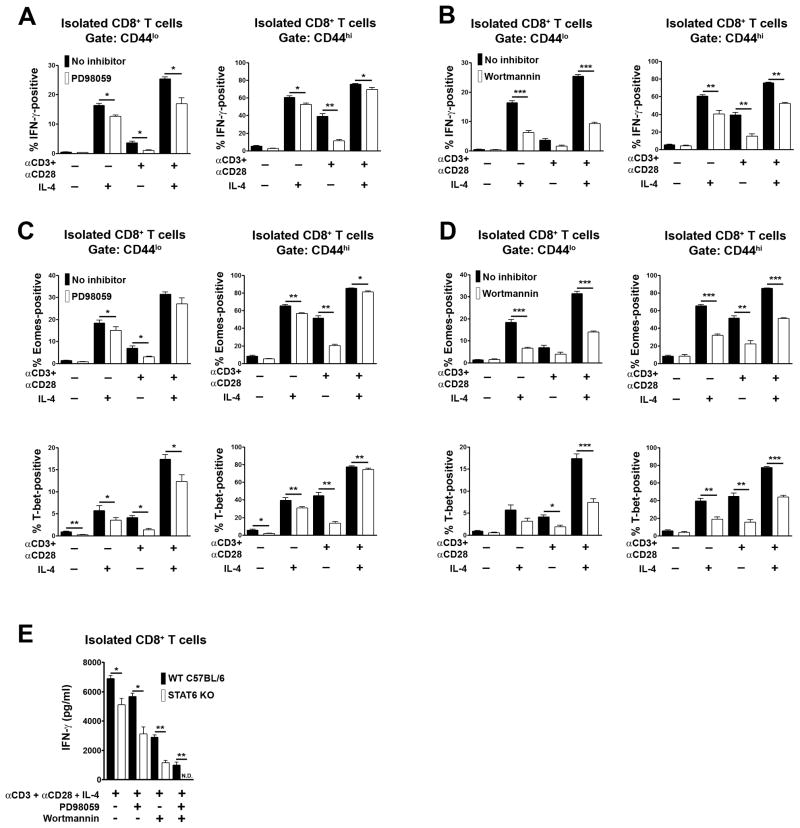
CD8+ T cell synthesis of IFN-γ is an important component of the CD8+ T cell immune response. In short-term cultures of murine pan-T cells, we found that IL-4 was the principal cytokine responsible for driving IFN-γ synthesis by CD3/CD28-activated CD8+ T cells. IL-4 was able to induce low levels of IFN-γ mRNA in CD8+ T cells even in the absence of CD3/CD28 engagement, although concomitant CD3/CD28 stimulation was necessary for IFN-γ secretion. IL-4 induction of IFN-γ was explained by its ability to induce Eomesodermin and T-bet transcription factors whose expression was further increased by CD3/CD28. Expression of Eomesodermin, T-bet and IFN-γ induced by IL-4 was partially dependent upon activation of MAPK and PI3K but independent of the canonical IL-4-activated transcription factor, STAT6. In contrast, expression of IFN-γ induced by IL-4/CD3/CD28 stimulation showed additional dependency upon STAT6 which functions to increase expression of Eomesodermin specifically. These novel findings point to a function for IL-4 as a direct regulator of IFN-γ expression in CD8+ T cells and reveal the molecular mechanisms involved.
Copyright © 2011 Elsevier Ltd. All rights reserved.
Conflict of interest statement
The authors have no financial conflicts of interest.
Figures
Similar articles
-
Interleukin-4 regulates eomesodermin in CD8+ T cell development and differentiation.PLoS One. 2014 Sep 10;9(9):e106659. doi: 10.1371/journal.pone.0106659. eCollection 2014. PLoS One. 2014. PMID: 25207963 Free PMC article.
-
CD28 costimulation is required not only to induce IL-12 receptor but also to render janus kinases/STAT4 responsive to IL-12 stimulation in TCR-triggered T cells.Eur J Immunol. 2001 May;31(5):1456-64. doi: 10.1002/1521-4141(200105)31:5<1456::AID-IMMU1456>3.0.CO;2-A. Eur J Immunol. 2001. PMID: 11465102
-
[Interleukin-12 restores and promotes the T-cell immune function inhibited by 5-fluorouracil].Ai Zheng. 2007 Aug;26(8):801-8. Ai Zheng. 2007. PMID: 17697537 Chinese.
-
Double-Edged Sword: Interleukin-2 Promotes T Regulatory Cell Differentiation but Also Expands Interleukin-13- and Interferon-γ-Producing CD8+ T Cells via STAT6-GATA-3 Axis in Systemic Lupus Erythematosus.Front Immunol. 2021 Mar 2;12:635531. doi: 10.3389/fimmu.2021.635531. eCollection 2021. Front Immunol. 2021. PMID: 33763079 Free PMC article.
-
Interleukin (IL) 4, in the absence of antigen stimulation, induces an anergy-like state in differentiated CD8+ TC1 cells: loss of IL-2 synthesis and autonomous proliferation but retention of cytotoxicity and synthesis of other cytokines.J Exp Med. 1995 Nov 1;182(5):1505-15. doi: 10.1084/jem.182.5.1505. J Exp Med. 1995. PMID: 7595220 Free PMC article.
Cited by
-
The Ras GTPase-activating protein neurofibromin 1 promotes the positive selection of thymocytes.Mol Immunol. 2013 Oct;55(3-4):292-302. doi: 10.1016/j.molimm.2013.03.005. Epub 2013 Mar 20. Mol Immunol. 2013. PMID: 23522726 Free PMC article.
-
Type I interferons regulate eomesodermin expression and the development of unconventional memory CD8(+) T cells.Nat Commun. 2015 May 8;6:7089. doi: 10.1038/ncomms8089. Nat Commun. 2015. PMID: 25953241 Free PMC article.
-
Cytoskeleton proteins, the structural basis of T-lymphocyte and TEC restructure during rapid thymus regeneration.Histol Histopathol. 2025 Sep;40(9):1355-1366. doi: 10.14670/HH-18-897. Epub 2025 Mar 4. Histol Histopathol. 2025. PMID: 40084412 Review.
-
The Effect of Unconventional Cytokine Combinations on NK-Cell Responses to Viral Infection.Front Immunol. 2021 Mar 19;12:645850. doi: 10.3389/fimmu.2021.645850. eCollection 2021. Front Immunol. 2021. PMID: 33815404 Free PMC article. Review.
-
Recombinant horse interleukin-4 and interleukin-10 induced a mixed inflammatory cytokine response in horse peripheral blood mononuclear cells.Vet World. 2019;12(4):496-503. doi: 10.14202/vetworld.2019.496-503. Epub 2019 Apr 3. Vet World. 2019. PMID: 31190704 Free PMC article.
References
-
- Allan W, Tabi Z, Cleary A, Doherty PC. Cellular events in the lymph node and lung of mice with influenza. Consequences of depleting CD4+ T cells. J Immunol. 1990;144:3980–6. - PubMed
-
- Buller RM, Holmes KL, Hugin A, Frederickson TN, Morse HC., 3rd Induction of cytotoxic T-cell responses in vivo in the absence of CD4 helper cells. Nature. 1987;328:77–9. - PubMed
-
- Shedlock DJ, Shen H. Requirement for CD4 T cell help in generating functional CD8 T cell memory. Science. 2003;300:337–9. - PubMed
Publication types
MeSH terms
Substances
Grants and funding
LinkOut - more resources
Full Text Sources
Research Materials
Miscellaneous
