. 2011 Nov 11;147(4):853-67.
doi: 10.1016/j.cell.2011.10.022.

Systematic discovery of TLR signaling components delineates viral-sensing circuits

Affiliations

Systematic discovery of TLR signaling components delineates viral-sensing circuits

Nicolas Chevrier et al. Cell. .

Abstract

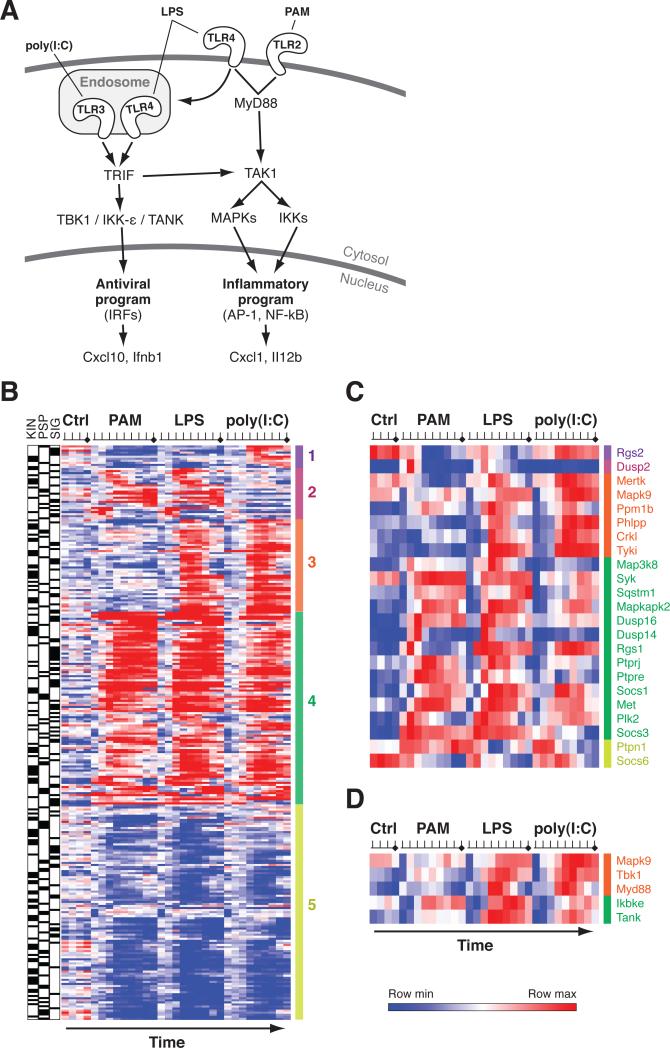
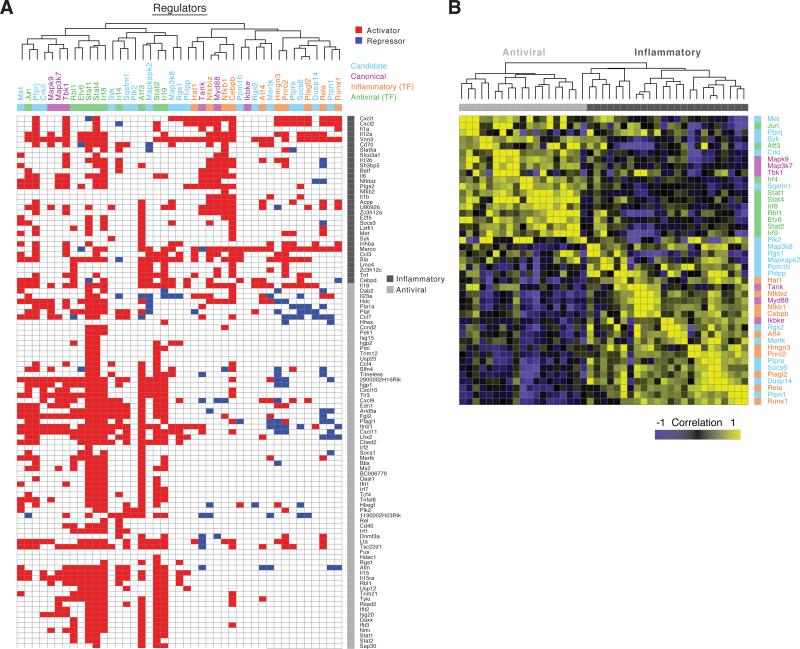
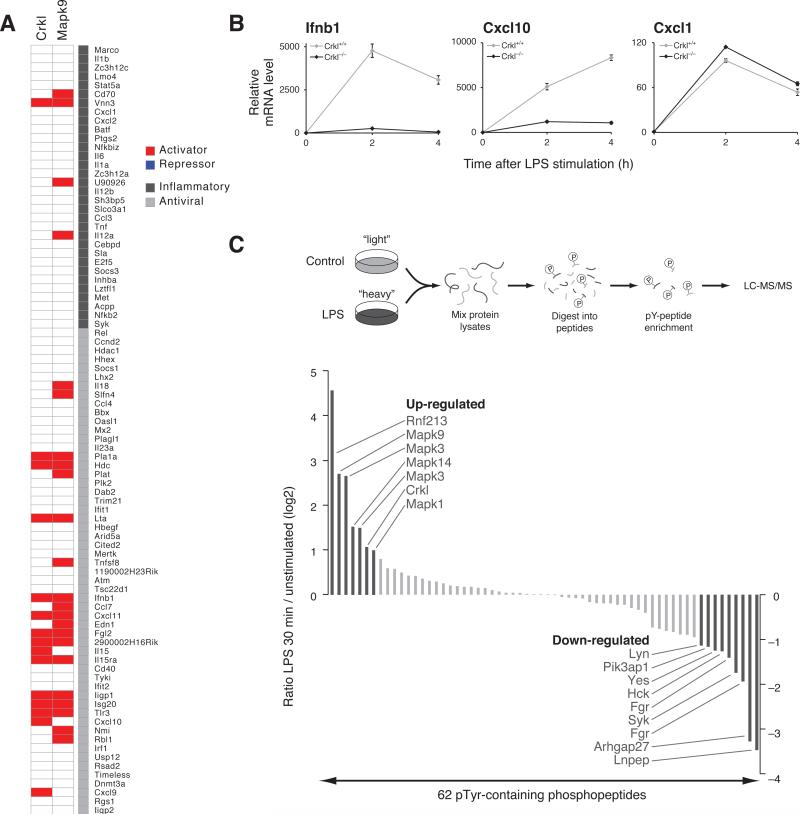
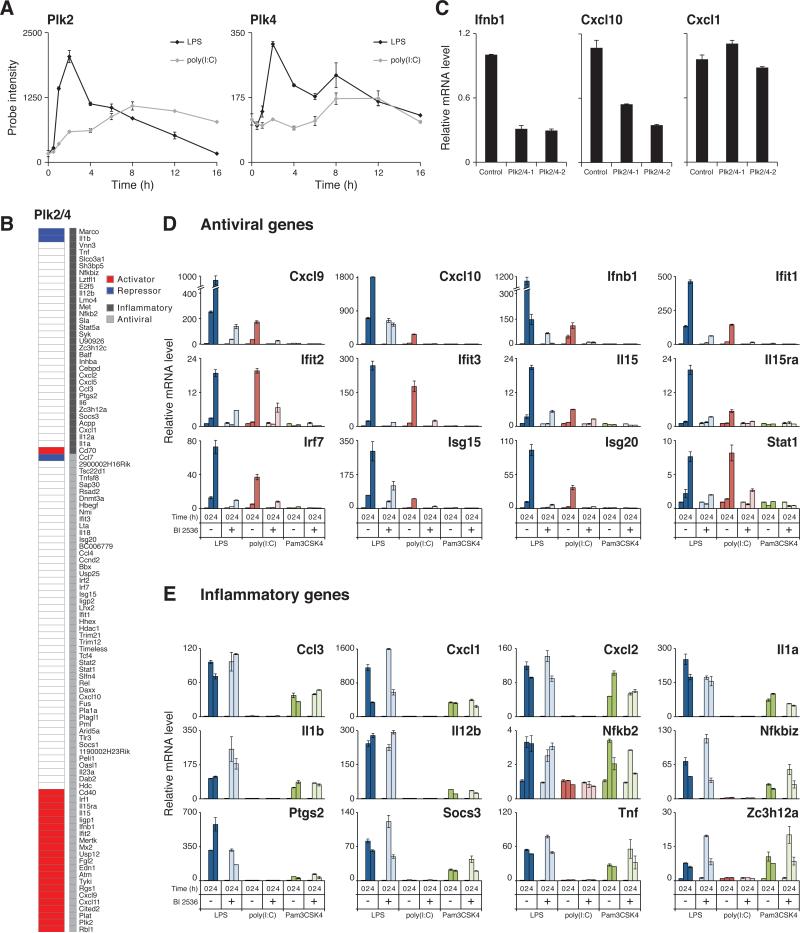
Deciphering the signaling networks that underlie normal and disease processes remains a major challenge. Here, we report the discovery of signaling components involved in the Toll-like receptor (TLR) response of immune dendritic cells (DCs), including a previously unkown pathway shared across mammalian antiviral responses. By combining transcriptional profiling, genetic and small-molecule perturbations, and phosphoproteomics, we uncover 35 signaling regulators, including 16 known regulators, involved in TLR signaling. In particular, we find that Polo-like kinases (Plk) 2 and 4 are essential components of antiviral pathways in vitro and in vivo and activate a signaling branch involving a dozen proteins, among which is Tnfaip2, a gene associated with autoimmune diseases but whose role was unknown. Our study illustrates the power of combining systematic measurements and perturbations to elucidate complex signaling circuits and discover potential therapeutic targets.


Figures

Figure 1
Figure 1. mRNAs of signaling components are differentially regulated upon Toll-like receptor (TLR) stimulation
(A) Simplified schematic of the TLR2, 3, and 4 pathways (Takeuchi and Akira, 2010). (B) mRNA expression profiles of differentially expressed signaling genes. Shown are expression profiles for 280 differentially expressed signaling genes (rows) at different time points (columns): a control time course (no stimulation, Ctrl) and following stimulations with Pam3CSK4 (PAM), lipopolysaccharide (LPS), and poly(I:C). Tick marks: time point post-stimulation (0.5, 1, 2, 4, 6, 8, 12, 16, 24 h). Shown are genes with at least a 1.7 fold change in expression compared to pre-stimulation levels in both duplicates of at least one time point. The three leftmost columns indicate kinase (KIN), phosphatase (PSP), and signaling regulators (SIG) (black bars). Values from duplicate arrays were collapsed and gene expression profiles were hierarchically clustered. The rightmost color-coded column indicates the 5 major expression clusters. (C and D) mRNA expression profiles of candidate (C) and canonical (D) TLR signaling regulators selected for subsequent experiments. The color-coding of the gene names highlight the corresponding expression cluster from the complete matrix from A. See also Table S1.
Figure 2
Figure 2. A perturbation strategy assigns function to signaling components within the TLR pathways
(A) Perturbation profiles of six canonical (purple) and 17 candidate (blue) signaling components, and 20 core TLR transcriptional regulators belonging to the inflammatory (orange) and the antiviral (green) programs. Shown are the perturbed regulators (columns) and their statistically significant effects (False discovery rate, FDR < 0.02) on each of the 118 TLR signature genes (rows). Red: significant activating relation (target gene expression decreased following perturbation); blue: significant repressing relation (target gene expression increased following perturbation); white: no significant effect. The right-most column categorizes signature genes into antiviral (light grey) and inflammatory (dark grey) programs. (B) Functional characterization based on similarity of perturbation profiles. Shown is a correlation matrix of the perturbation profiles from A. Yellow: positive correlation; purple: negative correlation; black: no correlation. See also Figure S1 and S2, and Table S2.
Figure 3
Figure 3. Crkl adaptor functions in the antiviral arm of TLR4 signaling
(A) Comparison of Crkl and Mapk9 knockdown profiles. Shown are the effects of Crkl and Mapk9 perturbation (columns) on the 118 signature genes (rows). Data was extracted from Figure 2A. (B) Inhibition of transcription of antiviral cytokines in Crkl−/− BMDCs. Shown are mRNA levels (qPCR; relative to t = 0) for Ifnb1 (left), Cxcl10 (middle) and Cxcl1 (right) in three replicates per time point. Error bars represent the SEM (n = 3 mice). (C) Crkl phosphorylation is induced following LPS stimulation. Top: Schematic depiction of experimental workflow. From left: Protein lysates from unstimulated (Control) and LPS-treated BMDCs grown in “light” and “heavy” SILAC medium were mixed (1:1) and digested into peptides with trypsin before phospho-tyrosine (pY) peptide enrichment by immunoprecipitation, and LC-MS/MS analysis. Bottom: Shown are the differential phosphorylation levels (log 2 ratios, Y axis) of all 62 phosphopeptides identified and quantified by LC-MS/MS (X axis). Black: peptides with more than 2 fold differential expression (left: induced; right: repressed). See also Table S3.
Figure 4
Figure 4. Polo-like kinase (Plk) 2 and 4 regulate the antiviral program
(A) Similarity of Plk2 and Plk4 mRNA expression profiles. Shown are mRNA levels (from Figure 1B) of Plk2 (left) and Plk4 (right) following stimulation with LPS (black) or poly(I:C) (grey). (B) Double knockdown of Plk2 and 4 represses the antiviral signature. Shown are significant changes in expression of TLR signature genes (rows) following double knockdown of Plk2 and 4. Red and blue mark significant hits as in Figure 2, only for genes where the effect was consistent between the two independent combinations of shRNAs. (C) Double knockdown of Plk2 and 4 represses antiviral cytokine mRNAs. Shown are expression levels (qPCR) relative to control shRNAs (Control) for two antiviral cytokines (Ifnb1 and Cxcl10) and for an inflammatory cytokine (Cxcl1), following LPS stimulation in BMDCs using two independent combinations of shRNAs (Plk2/4-1, Plk2/4-2). Three replicates for each experiment; error bars are the SEM. (D and E) BI 2536 specifically abrogates transcription of antiviral genes without affecting inflammatory genes following stimulation with LPS, poly(I:C), or Pam3CSK4. Shown are mRNA levels (qPCR; relative to t = 0) for 12 indicated antiviral (D) and 12 inflammatory (E) genes in BMDCs treated with BI 2536 (1 μM; dark color bars) or DMSO vehicle (light color bars) and stimulated for 0, 2 or 4 h with LPS (dark and light See also Figures S3 and S4 and Table S4.
Figure 5
Figure 5. BI 2536-mediated Plk inhibition blocks IRF3 nuclear translocation in DCs
(A) DCs on nanowires (NW) undergo normal morphological changes upon LPS stimulation. Shown are electron micrographs of BMDCs plated on bare vertical silicon NW that were left unstimulated (left; Control) or stimulated with LPS (right). Scale bars, 5 μm. (B-E) BI 2536 inhibits IRF3, but not NF-κB p65, nuclear translocation following TLR stimulation. (B and D) Shown are confocal micrographs of BMDCs plated on vertical silicon NW pre-coated with vehicle control (DMSO; B and D), Plk inhibitor (BI 2536; B and D), or control Jnk inhibitor (SP 600125; B), and stimulated with poly(I:C) for 2 h (B) or LPS for 30 min (D) (reflecting peak time of nuclear translocation for IRF3 and NF-κB p65, respectively), or left unstimulated (B and D). Cells were analyzed for DAPI (B and D), IRF3 (B) and NF-κB p65 subunit (D) staining. Scale bars, 5 μM. (C and E) Nuclear translocation (from confocal micrographs) of IRF3 (C) and NF-κB p65 (E) was quantified using DAPI staining as a nuclear mask (purple circles; overlay in B and D) to determine the ratio of total versus nuclear fluorescence (Y axis) in BMDCs cultured on NW coated with different amounts of BI 2536 or SP 600125, or with vehicle control (DMSO; X axis). Three replicates in each experiment; error bars are the SEM. See also Figure S5.
Figure 6
Figure 6. Plks are critical in the induction of type I interferons in vitro and in vivo
(A) IFN-inducing pathways in conventional DCs (cDCs) and plasmacytoid DCs (pDCs). (B, C) BI 2536 inhibits mRNA levels for antiviral cytokines in response to diverse stimuli in cDCs and pDCs. Shown are Ifnb1, Cxcl10 and Cxcl1 mRNA levels (qPCR; relative to t = 0) in cells treated with BI 2536 (1 μM; white bars) or DMSO vehicle (black bars) in cDCs (B) infected with VSV (MOI 1; B top) or with EMCV (MOI 10; B bottom), and in pDCs (C) stimulated with CpG type A or B, or infected with EMCV (MOI 10). Three replicates in each experiment; error bars are the SEM. (D) BI 2536 inhibits the CpG-A response, but has little effect on the CpG-B response. Shown are mRNA levels (nCounter) for the 118 TLR signature genes (rows) in pDCs treated with DMSO vehicle or BI 2536 (1 μM) and left untreated (Ctrl) or stimulated with CpG-A or -B for 6 h (columns). Three clusters of genes are shown: CpG-A-specific (top), CpG-B-specific (bottom), and shared by CpG-A and -B (middle). (E-G) BI 2536 inhibits IFN-β production in primary mouse lung fibroblasts (MLFs), leading to an increase in viral replication. MLFs treated with BI 2536 (1 μM; white bars) or vehicle control (DMSO; black bars) were infected with influenza ΔNS1 or PR8 strains at indicated MOIs. Shown are Ifnb1 mRNA levels measured by qPCR (relative to t = 0; E), viral replication as measured by luciferase (Luc) activity in reporter cells (F), and cell viability measured by CellTiter-Glo assay (G). (H and I) BI 2536 inhibits antiviral cytokine mRNA production, while increasing viral replication during in vivo VSV infection. Shown are Ifnb1, Cxcl10 and Cxcl1 mRNA (H), and VSV viral RNA (I) levels (qPCR; relative to uninfected animals) from popliteal lymph nodes of mice injected with BI 2536 (white circles) or DMSO vehicle (black circles) prior to and during the course of infection with VSV (intra-footpad). Nodes were harvested six hours post-infection. Each circle represents one animal (n = 3). Data is representative of three independent experiments for each condition. See also Figure S6 and Table S5.
Figure 7
Figure 7. Unbiased phosphoproteomics identifies a Plk-dependent antiviral pathway
(A) BI 2536 does not affect phosphorylation and protein levels of known TLR signaling nodes. Shown are representative MicroWestern Array (MWA; see Experimental Procedures) blots (left) obtained from analyzing lysates from BMDCs pre-treated with DMSO, BI 2536 (1 μM), or SP 600125 (5 μM) and stimulated with LPS for 0, 20, 40, 80 min. Blots were analyzed using indicated antibodies (left most), and fold change in fluorescence signals was quantified relative to t = 0 (right). Error bars are the SEM of triplicate MWA blots. (B) BI 2536 affects protein phosphorylation levels during LPS stimulation. Top: Schematic depiction of experimental workflow. From left to right: LPS-stimulated BMDCs cultured in “heavy” or “light” SILAC medium were pre-treated with BI 2536 (1 μM) or DMSO, respectively. Protein lysates were mixed (1:1) and digested into peptides with trypsin, before phospho-serine, -threonine and -tyrosine (pS/T/Y) peptide enrichment, and LC-MS/MS analysis. Bottom: Shown are the differential phosphorylation levels (average log2 ratios of two independent experiments; Y axis) of all 5061 and 5997 phosphopeptides respectively identified and quantified by LC-MS/MS (X axis) at 30 min (top) and 120 min (bottom) post-LPS stimulation. Dark grey: phosphopeptides with a significant change (Punadjusted < 0.001 for both time points; FDR30min = 0.05; FDR120min = 0.03; left: induced; right: repressed). Average ratios from phosphopeptides identified and quantified in two independent experiments are depicted. (C) Eleven Plk-dependent phosphoproteins significantly affect the expression of TLR signature genes. Shown are significant changes in expression of the TLR signature genes (rows) following knockdown of each of the 11 phosphoproteins (columns), following stimulation with LPS for 6 h. Red and blue mark significant hits (as presented in Figure 2) and are shown only for genes where the effect was consistent between two independent experiments. (D) Functional characterization based on similarity of perturbation profiles. Shown is a correlation matrix of the perturbation profiles from C (grey), and those from Figure 2B including canonical (purple) and candidate (blue) signaling components as well as core antiviral (green) and inflammatory (orange) transcriptional regulators. Yellow: positive correlation; purple: negative correlation; black: no correlation. (E) A Plk-dependent pathway in antiviral sensing. Shown is a diagram of a model of the Plk-dependent pathway of IFN induction in innate immunity. Out of the 11 Plk-dependent proteins described in C and D, only the 5 showing a phenotype with 2 independent shRNAs are depicted. See also Figure S7 and Tables S6 and S7.

References

    1. Amit I, Citri A, Shay T, Lu Y, Katz M, Zhang F, Tarcic G, Siwak D, Lahad J, Jacob-Hirsch J, et al. A module of negative feedback regulators defines growth factor signaling. Nat Genet. 2007;39:503–512. - PubMed
    1. Amit I, Garber M, Chevrier N, Leite AP, Donner Y, Eisenhaure T, Guttman M, Grenier JK, Li W, Zuk O, et al. Unbiased reconstruction of a mammalian transcriptional network mediating pathogen responses. Science. 2009;326:257–263. - PMC - PubMed
    1. Archambault V, Glover DM. Polo-like kinases: conservation and divergence in their functions and regulation. Nat Rev Mol Cell Biol. 2009;10:265–275. - PubMed
    1. Banchereau J, Pascual V. Type I interferon in systemic lupus erythematosus and other autoimmune diseases. Immunity. 2006;25:383–392. - PubMed
    1. Barbie DA, Tamayo P, Boehm JS, Kim SY, Moody SE, Dunn IF, Schinzel AC, Sandy P, Meylan E, Scholl C, et al. Systematic RNA interference reveals that oncogenic KRAS-driven cancers require TBK1. Nature. 2009;462:108–112. - PMC - PubMed

Publication types

Associated data