. 2012 Feb;45(2):751-62.
doi: 10.1016/j.nbd.2011.10.022. Epub 2011 Nov 7.

Microarray analysis of CA1 pyramidal neurons in a mouse model of tauopathy reveals progressive synaptic dysfunction

Affiliations

Microarray analysis of CA1 pyramidal neurons in a mouse model of tauopathy reveals progressive synaptic dysfunction

Melissa J Alldred et al. Neurobiol Dis. 2012 Feb.

Abstract

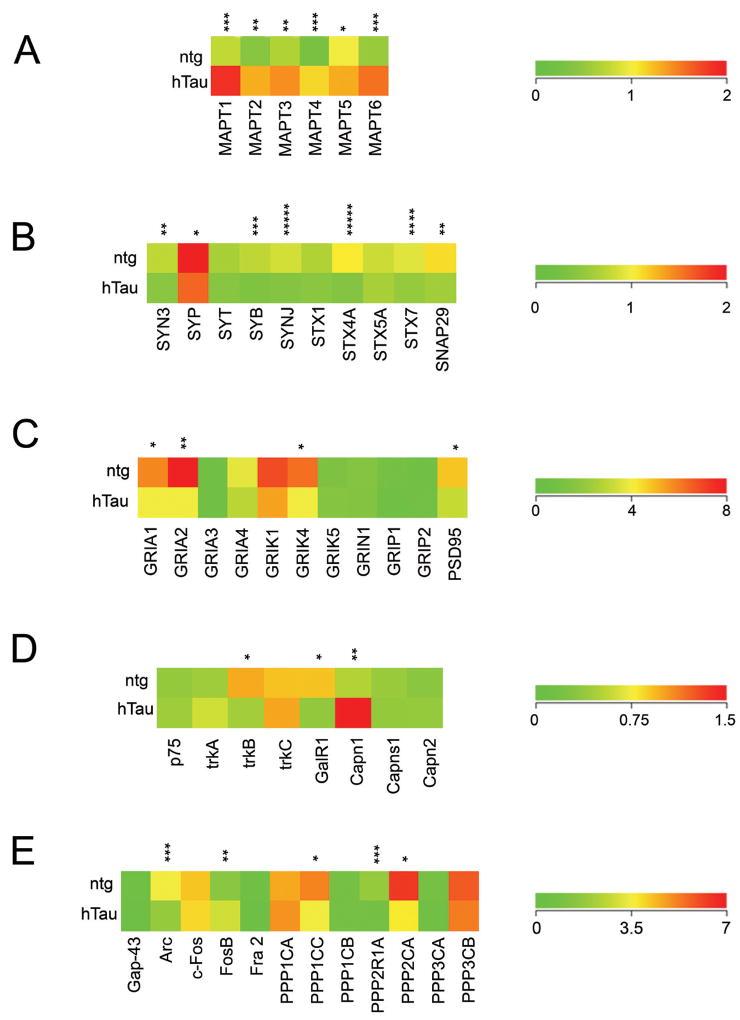
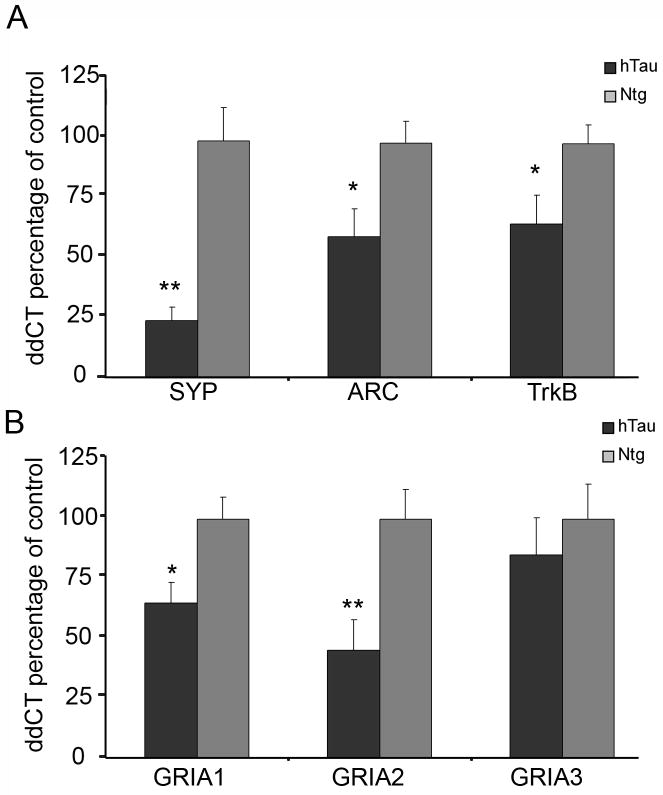
The hTau mouse model of tauopathy was utilized to assess gene expression changes in vulnerable hippocampal CA1 neurons. CA1 pyramidal neurons were microaspirated via laser capture microdissection followed by RNA amplification in combination with custom-designed microarray analysis and qPCR validation in hTau mice and nontransgenic (ntg) littermates aged 11-14months. Statistical analysis revealed ~8% of all the genes on the array platform were dysregulated, with notable downregulation of several synaptic-related markers including synaptophysin (Syp), synaptojanin, and synaptobrevin, among others. Downregulation was also observed for select glutamate receptors (GluRs), Psd-95, TrkB, and several protein phosphatase subunits. In contrast, upregulation of tau isoforms and a calpain subunit were found. Microarray assessment of synaptic-related markers in a separate cohort of hTau mice at 7-8months of age indicated only a few alterations compared to the 11-14month cohort, suggesting progressive synaptic dysfunction occurs as tau accumulates in CA1 pyramidal neurons. An assessment of SYP and PSD-95 expression was performed in the hippocampal CA1 sector of hTau and ntg mice via confocal laser scanning microscopy along with hippocampal immunoblot analysis for protein-based validation of selected microarray observations. Results indicate significant decreases in SYP-immunoreactive and PSD-95-immunoreactive puncta as well as downregulation of SYP-immunoreactive and PSD-95-immunoreactive band intensity in hTau mice compared to age-matched ntg littermates. In summary, the high prevalence of downregulation of synaptic-related genes indicates that the moderately aged hTau mouse may be a model of tau-induced synaptodegeneration, and has profound effects on how we perceive progressive tau pathology affecting synaptic transmission in AD.


Figures

Figure 1
Figure 1
LCM of CA1 neurons and TC RNA amplification. A. LCM was performed on 6 μm thick tissue sections of hTau and ntg mice. The CA1 region of hippocampus was immunostained with antibodies directed against neurofilaments for hippocampal pyramidal neuron detection and subsequent microaspiration. Scale bar: 25 μm. B. CA1 neurons were isolated by applying laser pulses (black circles) over desired neurons. Note that tissue sections were dehydrated and not coverslipped to enable proper execution of the LCM process. Scale bar: 20 μm. C. CA1 region of hippocampus seen after microaspiration, with cells captured by LCM removed and adjacent immunostained CA1 neurons remaining in the tissue section. Scale bar: 40 μm. D. Captured CA1 neurons were visualized on a clean slide for contrast. Scale bar: 25 μm. E. Schematic overview of the TC RNA amplification procedure. F. Representative photomicrograph illustrating intensely labeled PHF1-immunoreactive CA1 neurons within the hippocampus of an aged hTau mouse. The inset depicts profuse intracellular phospho-tau immunoreactivity within the cell body of CA1 neurons. G. PHF1 immunoreactivity was localized principally to neuropil surrounding the CA1 pyramidal layer in age-matched ntg littermates compared to the intracellular labeling in hTau mice. Scale bar F, G: 100 μm. Inset scale bar F, G: 50 μm.
Figure 2
Figure 2
Color-coded heatmaps depicting differential regulation of select transcripts in 11-14 month old hTau mice compared to age-matched ntg littermates. A. Upregulation of the 6 tau isoforms were found in hTau mice. Asterisk denotes (p < 0.05), double asterisk denotes (p < 0.005), and triple asterisk denotes (p < 0.001). B. Downregulation of a high percentage of individual synaptic-related markers was observed (e.g., Syn3, Syb, Syp, Synj, Stx4a, Stx7, and Snap29), making this class of transcripts the most affected overall within the aged hTau mouse. Asterisk denotes (p < 0.01), double asterisk denotes (p < 0.004), triple asterisk denotes (p < 0.003), quadruple asterisk denotes (p < 0.002), and quintuple asterisk denotes (p < 0.001). C. Downregulation of select AMPA receptor subunits (Gria1 and Gria2), a KA receptor (Grik4), and Psd95 is demonstrated. No differential regulation of NMDA receptors was found. Asterisk denotes (p < 0.006) and double asterisk denotes (p < 0.001). D. Downregulation of the BDNF receptor TrkB, but not p75, TrkA, or TrkC was observed along with the galanin receptor Galr1. In contrast, significant upregulation of the large subunit of the protease calpain 1 (Capn1) was found in hTau mice. Asterisk denotes (p < 0.002) and double asterisk denotes (p < 0.001). E. Selective downregulation of PP1 (Ppp1cc) and PP2 (Ppp2r1a and Ppp2ca) subunits that regulate tau dephosphorylation were observed in hTau mice. Additionally, significant downregulation of the immediate-early gene Arc contrasted the up regulation immediate-early gene Fosb in hTau mice. Asterisk denotes (p < 0.01), double asterisk denotes (p < 0.004), and triple asterisk denotes (p < 0.001).
Figure 3
Figure 3
qPCR validation of microarray observations in microdissected CA1 pyramidal neurons in 11-14 month old hTau and age-matched ntg littermates. The ddCT method was used for quantitative analysis and data is depicted as percentage of ntg expression ± SD. A. Syp, Arc, and TrkB PCR products displayed significant downregulation in hTau mice compared to ntg littermates. Asterisk denotes (p < 0.04) and double asterisk denotes (p < 0.01). B. Downregulation of Gria1 and Gria2, but not Gria3 PCR products was found, confirming the microarray results. Asterisk denotes (p < 0.03) and double asterisk denotes (p < 0.02).
Figure 4
Figure 4
Confocal microscopy combined with unbiased quantitative morphometric analysis was performed within the CA1 region of hippocampus for two synaptic proteins (SYP and PSD-95), which were downregulated via microarray and qPCR analyses. A. Representative confocal images depicting downregulation of SYP (red) puncta and PSD-95 (green) puncta in hTau mice compared to ntg littermates. A merged image indicates the overlapping distribution of SYP and PSD-95 (yellow) puncta within the CA1 pyramidal layer. B. Morphometric analyses of the confocal images confirmed the expression profiling results, as significantly lower signal intensity levels for SYP were found in hTau mice. No significant differences were found in the number of puncta in hTau and ntg mice. Moreover, no significant differences exist between hTau and ntg mice in terms of punctal area measurements. Asterisk denotes (p < 0.02). C. Similar to the SYP-immunoreactive results, down regulation of PSD-95-immunoreactivity was found in hTau mice. No significant differences in the number of puncta or punctal area measurements were observed. Asterisk denotes (p < 0.03).
Figure 5
Figure 5
Immunoblotting using hippocampal CA1 sector punches to assess whether selected transcriptional alterations resulted in commensurate protein level changes in hTau mice compared to ntg littermates at 7-10 months of age (A) and 12-16 months of age (B). Expression level data was normalized to TUBB expression ± SD. A. Downregulation of SYP and PSD-95 expression was observed in hTau mice compared to age matched littermates. Asterisk denotes (p < 0.01) and double asterisk denotes (p < 0.008). B. Downregulation of GRIA1, GRIA2/3, PSD-95, and SYP was observed within the CA1 sector in 12-16 month old hTau mice, consistent with microarray, qPCR, and confocal analyses. Asterisk indicates (p < 0.01) and double asterisk indicates (p < 0.005). C. Representative immunoblots obtained from 13-14 month old hTau and ntg mice demonstrating downregulation of GRIA1, GRIA2/3, PSD-95, and SYP in hTau mice, consistent with microarray and qPCR findings in the CA1 region. Upregulation of tau is demonstrated in the hTau mice as a positive control.

References

    1. ABI. Guide to Performing Relative Quantitation of Gene Expression Using Real-Time Quantitative PCR. Applied Biosystems Product Guide. 2004:1–60.
    1. Alldred MJ, et al. Terminal continuation (TC) RNA amplification enables expression profiling using minute RNA input obtained from mouse brain. Int J Mol Sci. 2008;9:2091–2104. - PMC - PubMed
    1. Alldred MJ, et al. Terminal continuation (TC) RNA amplification without second strand synthesis. J Neurosci Methods. 2009;177:381–385. - PMC - PubMed
    1. Alldred MJ, et al. Distinct gamma2 subunit domains mediate clustering and synaptic function of postsynaptic GABAA receptors and gephyrin. J Neurosci. 2005;25:594–603. - PMC - PubMed
    1. Andorfer C, et al. Cell-cycle reentry and cell death in transgenic mice expressing nonmutant human tau isoforms. J Neurosci. 2005;25:5446–5454. - PMC - PubMed

Publication types

MeSH terms