. 2012 Jan 5;30(2):475-85.
doi: 10.1016/j.vaccine.2011.10.059. Epub 2011 Nov 10.

Protective immunity against mouse upper genital tract pathology correlates with high IFNγ but low IL-17 T cell and anti-secretion protein antibody responses induced by replicating chlamydial organisms in the airway

Affiliations

Protective immunity against mouse upper genital tract pathology correlates with high IFNγ but low IL-17 T cell and anti-secretion protein antibody responses induced by replicating chlamydial organisms in the airway

Chunxue Lu et al. Vaccine. .

Abstract

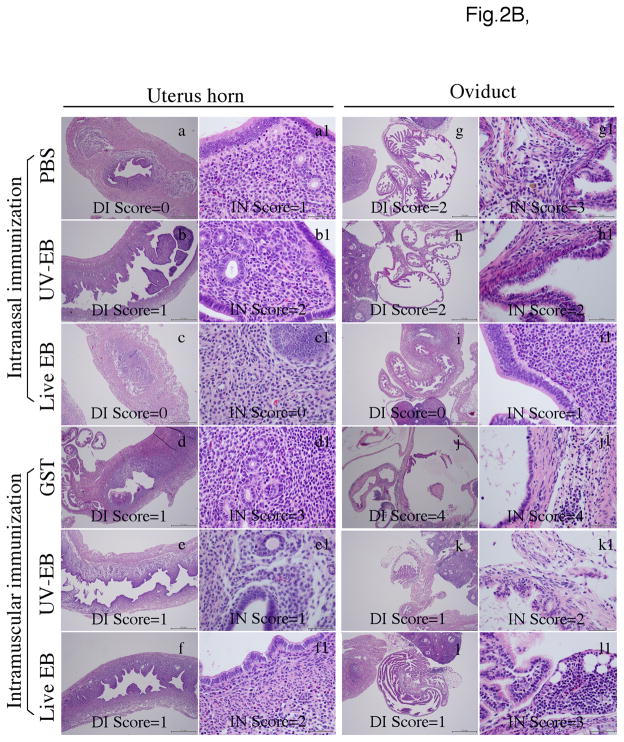
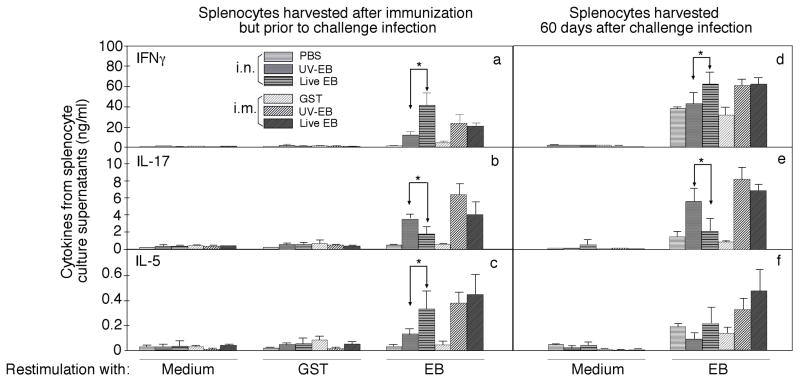
To search for optimal immunization conditions for inducing protective immunity against upper genital tract pathologies caused by chlamydial intravaginal infection, we compared protection efficacy in mice immunized intranasally or intramuscularly with live or inactivated Chlamydia muridarum organisms. Mice immunized intranasally with live organisms developed strong protection against both vaginal shedding of infectious organisms and upper genital tract pathologies. The protection correlated with a robust antigen-specific T cell response with high IFNγ but low IL-17. Although a significant level of IL-5 was also detected, these mice maintained an overall Th1-dorminant immunity following immunization and challenge infection. On the contrary, mice immunized intranasally with inactivated organisms or intramuscularly with live or inactivated organisms produced high levels of IL-17 and still developed significant upper genital tract pathologies. High titers of antibodies against chlamydial secretion antigens were detected only in mice immunized intranasally with live organisms but not mice in other groups, suggesting that the intranasally inoculated live organisms were able to undergo replication and immune responses to the chlamydial secretion proteins may contribute to protective immunity. These observations have provided important information on how to develop subunit vaccines for inducing protective immunity against urogenital infection with Chlamydia trachomatis organisms.


Figures

Fig. 1
Fig. 1. Effects of immunization on shedding of infectious chlamydial organisms following an intravaginal challenge infection
br(A) Groups of mice were immunized intranasally (i.n.) or intramuscularly (i.m.) with different chlamydial EB preps. For i.n. route, mice were given three doses of PBS or UV-EB + CpG 3 times on day 0, 20 & 30 as indicated on top the figure or live EB once on day 0. For i.m. route, three doses of GST protein + CpG + IFA (incomplete Freunds Adjuvant), UV-EB + CpG + IFA or live EB + CpG + IFA were given. (B) One month following the final immunization, mice were challenged intravaginally (i.v.) with 2×10⁴ IFUs of C. muridarum organisms and vaginal swabs were taken weekly as indicated along the x-axis for measuring the number of live organisms (expressed as inclusion forming units, IFUs). The IFUs from each swab was converted into Log10, and the log10 IFUs were used to calculate mean and standard deviation (SD) for each mouse group at a given time point as displayed along the y-axis. The log10 IFUs were compared between 6 groups of mice at each time point using ANOVA test, followed by a two-tailed Student’s t-test for comparing between a control group (PBS for i.n.; GST for i.m.) and a test group. Double asterisks ** indicate p<0.01 while single asterisk * p<0.05. The number of mice with detectable infectious units (IFUs) from each group and at each time point is listed in the chart at the bottom. (C) The number of mice with positive shedding was compared between a control and a test group using the Fisher’s Exact test. Note that the group immunized intranasally with live EBs displayed the most rapid clearance of intravaginal infection with only 5 of the 20 mice remained shedding of live organisms at a low level on day 7 and complete clearance on day 14. The data came from 3 independent experiments.
Fig. 2
Fig. 2. Effects of immunization on genital tract pathologies induced by intravaginal chlamydial infection
Groups of mice were immunized either i.n. or i.m. with live or UV-EBs and infected intravaginally with C. muridarum organisms as described in Fig.1 legend. Sixty days after infection, mice were sacrificed for evaluating pathologies of genital tract tissues under both naked eyes (for gross appearance) and microscope (for luminal dilatation & inflammatory cellular infiltration). (A) Representative images of the gross appearance of mouse genital tracts were presented from each of the 6 groups of mice as listed on the left of the figure. The entire genital tract from vagina to ovary was displayed from left to right (left panels) and the oviduct and ovary regions were amplified from both sides (right panels). Although the uterine horn regions from all mice appeared to be normal, significant hydrosalpinx in the oviduct regions developed in different groups of mice. Both the incidence and severity of hydrosalpinx were scored under naked eyes or stereoscope. Mice with hydrosalpinx in one (unilateral) or both (bilateral) oviducts were indicated at the right of the figure (white arrows). The severity of the hydrosalpinx was semi-quantitatively scored as described in the method section and examples of the hydrosalpinx severity scoring were indicated in the right panels. Both the incidence and severity of hydrosalpinx were compared statistically in table 1. (B) The urogenital tract tissues were sectioned for microscopic observation of inflammatory pathologies. Representative H&E stained section images covering either the uterine horn (panels a-f) or oviduct (g–l) regions were presented from each group (as indicated on the left). Each section was semi-quantitatively scored for both inflammatory infiltration (IN) and lumenal dilatation (DI) as described in the method section. Examples of the dilatation scores were indicated in the low amplification images (panels a-f for uterus horn; g-l for oviduct) while inflammatory infiltration scores were indicated in the high amplification images (panels a1 to f1 for uterine horn; g1–l1 for oviduct). The semi-quantitation results were presented in (C). Inflammation (panels a & c) and dilatation (b & d) scores (each derived from 5 different sections) assigned to individual mice were used to calculate the means and standard errors for each group as shown along the Y-axis. The mouse groups were indicated along the X-axis at the bottom while the tissue sources were indicated on the top. The scores were compared between different groups using ANOVA followed by the two-tailed Student t test. The data came from 3 independent experiments.
Fig. 3
Fig. 3. MoPn-specific cellular immune responses induced by immunization with live or UV-EB
organisms. The 6 groups of mice were immunized and infected as described in Fig.1 legend. Splenocytes were collected from the six groups of mice one month after the final immunization (prior to challenge infection, panels a–c) or two months after challenge infection (d–f) for in vitro re-stimulation with UV-inactivated MoPn EB organisms at 1×10⁶ IFUs per well or 10μg/mL GST or medium alone as indicated at the bottom of the figure. Three days after the stimulation, the culture supernatants were collected for IFNγ, IL-17 and IL-5 detection and the results were expressed as ng/ml as listed along the Y-axis (mean ± SD). The cytokine concentrations were compared between different groups using ANOVA followed by a two-tailed Student t test. Note that intranasal immunization with live organisms induced significantly higher levels of IFNγ & IL-5 but lower IL-17 than the dead organism-immunized group (* p<0.05) prior to challenge infection. The trend continued even after challenge infection. However, intramuscular immunization with either live or dead organisms induced significant levels of all 3 cytokines. The data came from one experiment with 5 mice in each group.
Fig. 4
Fig. 4. Chlamydia-specific humoral immune responses following immunization with live or UV-EB organisms
Serum samples were collected one month after the final immunization (prior to challenge infection) from six groups of mice (with 15 to 20 mice in each group) as shown along the X-axis and described in Fig.1 legend. (A) The total IgG antibody titers were determined using ELISA with C. muridarum organisms (UV-EBs) as antigens. The mouse sera were 5 fold serially diluted starting with 1:80. The mouse antibody binding to chlamydial organisms were detected with a goat anti-mouse IgG HRP conjugate and the results were expressed as absorbance as displayed along the Y-axis. Note that all EB-immunized mice produced significant levels of anti-chlamydial organism antibodies. (B) The Chlamydia-specific IgG antibodies were further isotyped using the same C. muridarum organism-coated ELISA plates. The ratios of IgG2a versus IgG1 from each group of mice were displayed along the Y-axis. The serum dilutions used for the isotyping were 1:80 for the two control groups and UV-EB i.n. group and 1:2000 for the rest of the groups. The IgG2a/IgG1 ratios maintained a similar trend when the sera were isotyped at different dilutions. Note that the highest ratio of IgG2a versus IgG1 was observed in the intranasal live EB immunization group (p<0.01 against any other groups). The data came from 3 independent experiments.
Fig. 5
Fig. 5. Mouse antibody reactivity with C. muridarum secretion proteins
(A) Mouse serum samples as described in Fig.4 legend (shown along the X-axis) were reacted with the following fusion proteins GST-CPAF (panel a), GST-TC0177 (b), GST-IncA (c) & GST-MOMP (d) immobilized onto glutathione-coated ELISA plates (via GST-glutathione interactions). The reactivity was recorded as absorbance at 405nm (shown along the Y-axis). Sera from the GST-immunized mice reacted equally well with all GST fusion proteins, indicated that all GST fusion proteins were coated onto the ELISA plates at equivalent levels. Although sera from all EB-immunized groups reacted with GST-MOMP, only the intranasal live EB immunization group significantly recognized the secretion proteins CPAF, TC0177 & IncA. The data came from 3 independent experiments. (B) Mice intranasally inoculated with 50 or intramuscularly with 1X10⁵ IFUs (n=5) were sacrificed on day 8 or 21 (X-axis) for titrating live organisms harvested from lungs or muscle tissues. The number of IFUs was calculated per lung or gram of muscle tissues and converted into log10 (Y-axis). The data came from one experiment with 5 mice in each group. (C) Mouse antibodies raised with chlamydial GST fusion proteins as shown on top of the images were used to localize the endogenous chlamydial proteins (red) in C. muridarum-infected HeLa cells. The cell samples were also co-labeled with a rabbit antiC. muridarum EB antibody (green) and DNA Hoechst dye (blue). Both CPAF and TC0177 (homolog of CT795, a known secreted protein of C. trachomatis) were secreted into cytosol of the infected cells while IncA to inclusion membrane. However, MOMP is restricted within the inclusions. The representative images came from one experiment and 3 independent experiments were carried out.

Similar articles

Cited by

References

    1. Centers for Disease Control and Prevention C; Services USDoHaH. Sexually Transmitted Disease Surveillance 2008. Atlanta, GA: Nov, 2009. http://www.cdc.gov/std/stats08/toc.htm.
    1. Rockey DD, Wang J, Lei L, Zhong G. Chlamydia vaccine candidates and tools for chlamydial antigen discovery. Expert Rev Vaccines. 2009 Oct;8(10):1365–77. - PubMed
    1. Sherman KJ, Daling JR, Stergachis A, Weiss NS, Foy HM, Wang SP, et al. Sexually transmitted diseases and tubal pregnancy. Sex Transm Dis. 1990 Jul-Sep;17(3):115–21. - PubMed
    1. Kinnunen AH, Surcel HM, Lehtinen M, Karhukorpi J, Tiitinen A, Halttunen M, et al. HLA DQ alleles and interleukin-10 polymorphism associated with Chlamydia trachomatis-related tubal factor infertility: a case-control study. Hum Reprod. 2002 Aug;17(8):2073–8. - PubMed
    1. Stephens RS. The cellular paradigm of chlamydial pathogenesis. Trends Microbiol. 2003 Jan;11(1):44–51. - PubMed

Publication types

MeSH terms