. 2012 Mar;52(3):701-10.
doi: 10.1016/j.yjmcc.2011.10.010. Epub 2011 Oct 20.

The transcriptional coactivators, PGC-1α and β, cooperate to maintain cardiac mitochondrial function during the early stages of insulin resistance

Affiliations

The transcriptional coactivators, PGC-1α and β, cooperate to maintain cardiac mitochondrial function during the early stages of insulin resistance

Riddhi Mitra et al. J Mol Cell Cardiol. 2012 Mar.

Abstract

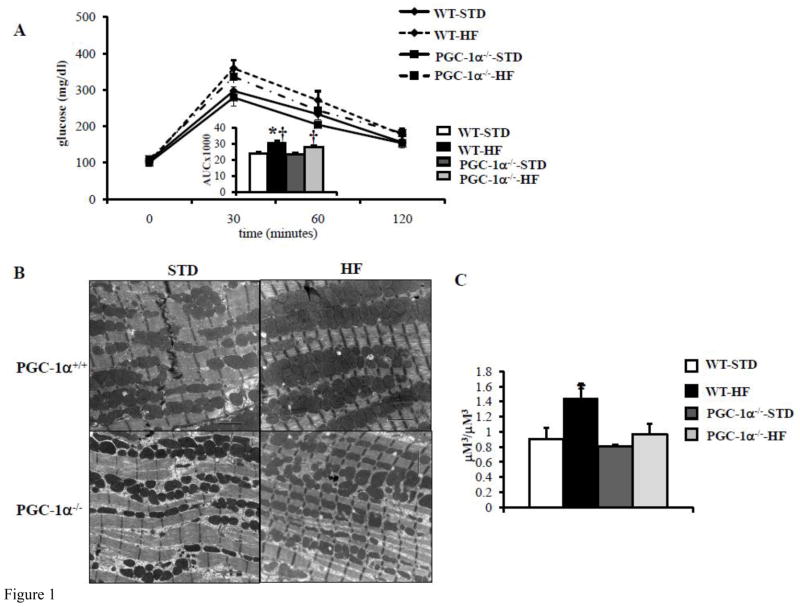
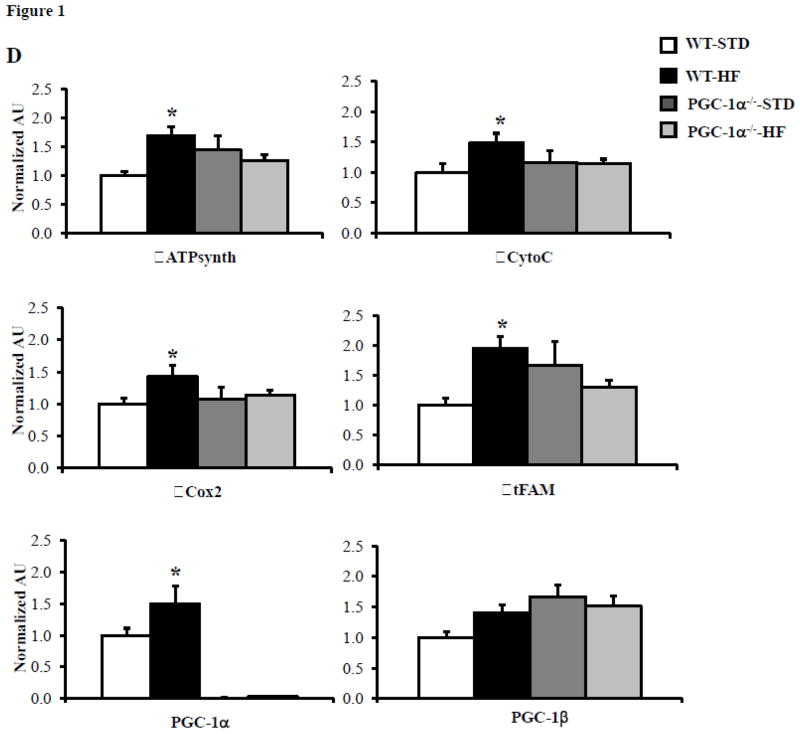
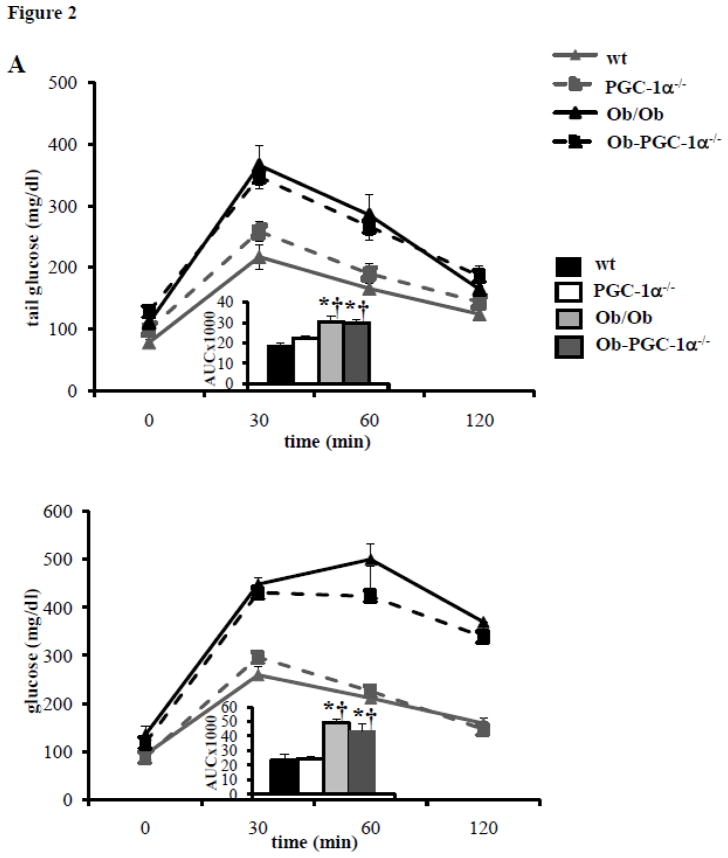
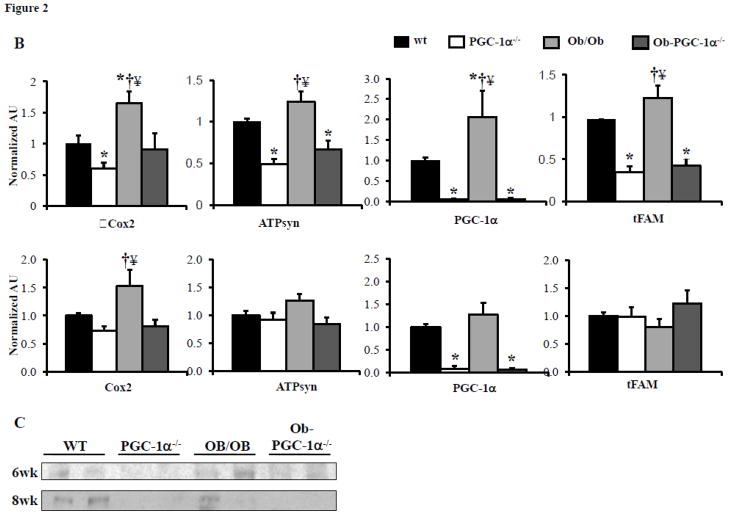
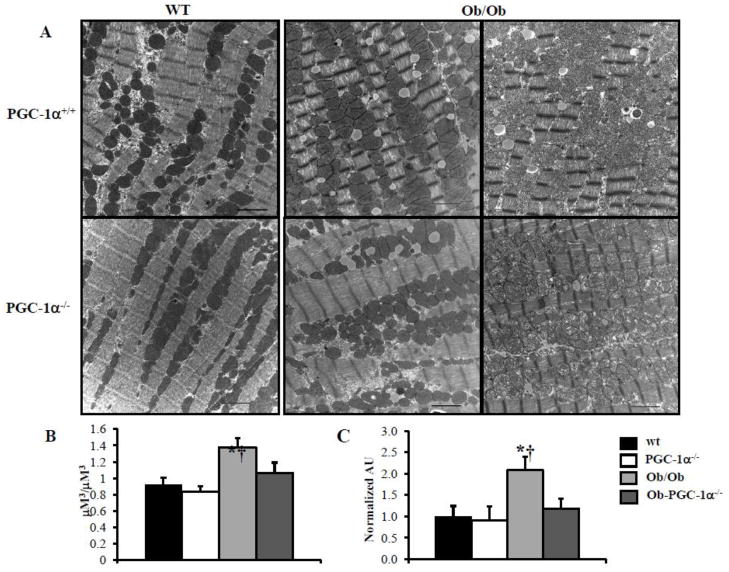
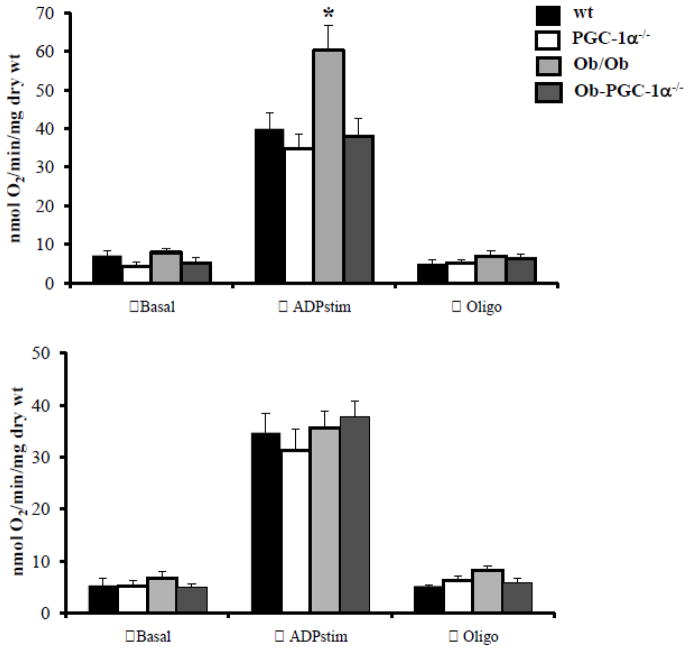
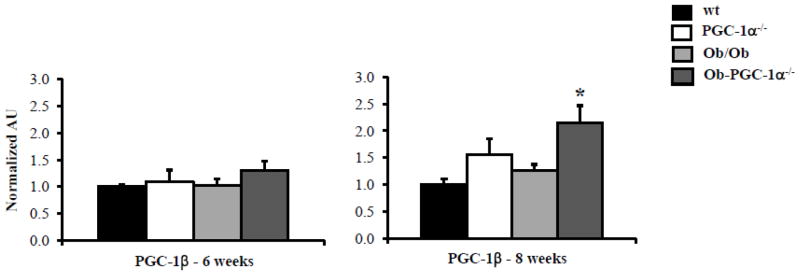
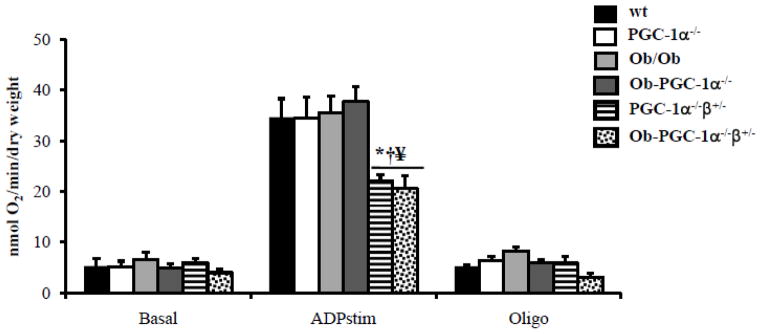
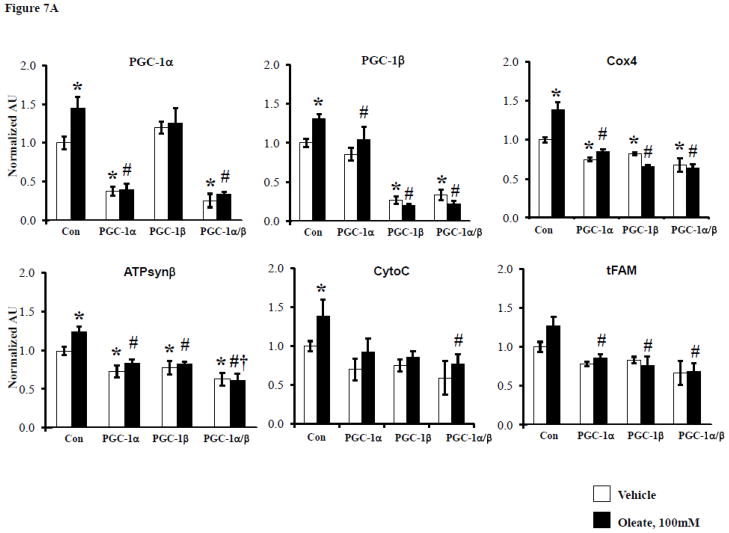
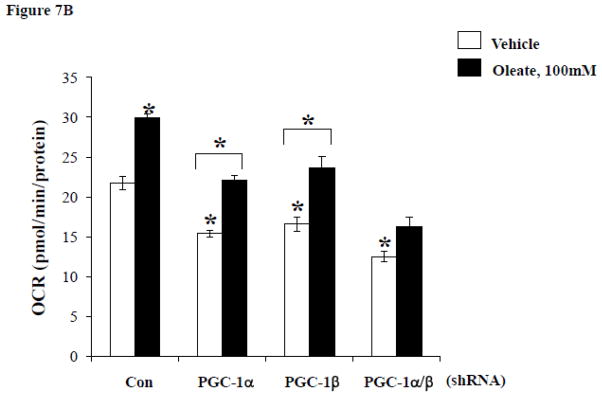
We previously demonstrated a cardiac mitochondrial biogenic response in insulin resistant mice that requires the nuclear receptor transcription factor PPARα. We hypothesized that the PPARα coactivator peroxisome proliferator-activated receptor gamma coactivator-1 alpha (PGC-1α) is necessary for mitochondrial biogenesis in insulin resistant hearts and that this response was adaptive. Mitochondrial phenotype was assessed in insulin resistant mouse models in wild-type (WT) versus PGC-1α deficient (PGC-1α(-/-)) backgrounds. Both high fat-fed (HFD) WT and 6 week-old Ob/Ob animals exhibited a significant increase in myocardial mitochondrial volume density compared to standard chow fed or WT controls. In contrast, HFD PGC-1α(-/-) and Ob/Ob-PGC-1α(-/-) hearts lacked a mitochondrial biogenic response. PGC-1α gene expression was increased in 6 week-old Ob/Ob animals, followed by a decline in 8 week-old Ob/Ob animals with more severe glucose intolerance. Mitochondrial respiratory function was increased in 6 week-old Ob/Ob animals, but not in Ob/Ob-PGC-1α(-/-) mice and not in 8 week-old Ob/Ob animals, suggesting a loss of the early adaptive response, consistent with the loss of PGC-1α upregulation. Animals that were deficient for PGC-1α and heterozygous for the related coactivator PGC-1β (PGC-1α(-/-)β(+/-)) were bred to the Ob/Ob mice. Ob/Ob-PGC-1α(-/-)β(+/-) hearts exhibited dramatically reduced mitochondrial respiratory capacity. Finally, the mitochondrial biogenic response was triggered in H9C2 myotubes by exposure to oleate, an effect that was blunted with shRNA-mediated PGC-1 "knockdown". We conclude that PGC-1 signaling is important for the adaptive cardiac mitochondrial biogenic response that occurs during the early stages of insulin resistance. This response occurs in a cell autonomous manner and likely involves exposure to high levels of free fatty acids.


Figures

Figure 1
Figure 1. PGC-1α deficiency blunts mitochondrial biogenesis response in glucose intolerant mice
A) Mean blood glucose (±SE) levels during GTT after 10 weeks of HF diet, (n=5–8). Total area under the glucose excursion curve (± SE) is displayed in the inset for the GTT. B) Representative EMs from papillary muscle from WT and PGC-1α−/− hearts on either high fat (HF) or standard (STD) diets. Black bars=2 micron length. C) Quantitative measurement of mitochondrial/myofibril cellular volume density (μm3/μm3) based on analysis of EMs (n=5 animals/group). D) Quantitative real-time rtPCR analysis of cardiac transcripts encoding ATP synthase beta (ATPsyn), Cytochrome C (cyto C), Cytochrome C oxidase 2 (Cox2), mitochondrial transcription factor A (tFAM), PGC-1α and PGC-1β in WT and PGC-1α−/− hearts from HF or STD diet. (n=9) Bars represent mean (± SE) arbitrary unit (AU) normalized to the WT value (=1.0) in each case. * p < 0.05 vs WT, † p < 0.05 vs PGC-1α−/−.
Figure 2
Figure 2. Characterization of glucose tolerance and cardiac mitochondrial target gene expression in Ob/Ob mice
A) Mean blood glucose (±SE) levels during GTT in 6 week (top) and 8 week-old (bottom) animals (n=6–10). Total area under the glucose excursion curve (± SE) is displayed in the inset for the GTT. B) Quantitative real-time rtPCR analysis of cardiac transcripts encoding genes as noted in Figure 1. Top- 6 week-old, bottom- 8 week-old. (n=9/genotype). Bars represent mean (± SE) arbitrary unit (AU) normalized to the WT value (=1.0) in each case. C) Representative Western blot for cardiac PGC-1α at 6 weeks and 8 weeks of age. * p < 0.05 vs WT, † p < 0.05 vs PGC-1α−/−, ¥ p < 0.05 vs Ob/Ob-PGC-1α−/−.
Figure 3
Figure 3. Mitochondrial biogenesis is blunted in PGC-1α deficient Ob/Ob animals
A) Representative EMs from papillary muscle from WT, PGC-1α−/−, Ob/Ob and Ob/Ob-PGC-1α−/− hearts at 8 weeks of age. White bars=2 micron length. B) Quantitative measurement of mitochondrial/myofibril cellular volume density (μm3/μm3) based on analysis of EMs (n=5 animals/group), displayed on left. Mean cardiac mtDNA levels (right panel) determined by real-time PCR analysis shown as arbitrary units (AU) (n=5–7 hearts/group) normalized to the WT value (=1.0). * p < 0.05 vs WT, † p < 0.05 vs PGC-1α−/−.
Figure 4
Figure 4. Mitochondrial respiration is impaired in PGC-1α deficient Ob/Ob animals
Mitochondrial respiration rates (V·O2) in saponin-permeabilized muscle strips prepared from WT, PGC-1α−/−, Ob/Ob and Ob/Ob-PGC-1α−/− hearts in the presence of palmitoyl-L-carnitine/malate at 6 weeks (top) and 8 weeks (bottom) of age. Mean values (± SE) are shown for basal, state 3 (ADP-stimulated), and oligomycin inhibited (oligo) respiration. (n=6 animals/group). * p < 0.05 vs WT.
Figure 5
Figure 5. PGC-1β compensates for loss of PGC-1α in older Ob/Ob-PGC-1α−/− animals
Quantitative real-time rtPCR analysis of cardiac transcript for PGC-1 β in 6 week and 8 week-old animals. (n=9–12/genotype). Bars represent mean (± SE) arbitrary unit (AU) normalized to the WT value (=1.0) in each case. * p < 0.05 vs WT.
Figure 6
Figure 6. Mitochondrial respiration is severely impaired with combined deficiency of PGC-1α and PGC-1β
Mitochondrial respiration rates (V·O2) in saponin-permeabilized muscle strips prepared from WT, PGC-1α−/−, Ob/Ob, Ob/Ob-PGC-1 α−/−, PGC-1α−/−β+/− and, Ob/Ob-PGCα−/−β+/− hearts in the presence of palmitoyl-L-carnitine/malate at 6 weeks (top) and 8 weeks (bottom) of age. Mean values (± SE) are shown for basal, state 3 (ADP-stimulated), and oligomycin inhibited (oligo) respiration. (n=6 animals/group). * p < 0.05 vs WT, † p < 0.05 vs PGC-1α−/−, § p < 0.05 vs Ob/Ob, ¥ p < 0.05 vs Ob/Ob-PGC-1α−/−.
Figure 7
Figure 7. PGC-1α and β deficiency alter cardiomyocyte gene expression and oxygen consumption in a cell autonomous manner
A) Quantitative real-time rtPCR analysis of transcripts (as described in Figure 1) from H9C2 cells treated with either vehicle or 100μM oleate after transfection with either control shRNA (Con) or shRNA targeting PGC-1α, PGC-1β or both. * p < 0.05 vs Con-vehicle, # p < 0.05 vs Con-oleate, † p < 0.05 vs PGC-1α or β-oleate. B) Mean (±SE) oxygen consumption in H9C2 cells treated in the same manner as in A. * p < 0.05 vs Con-vehicle or for comparison noted by lines.

References

    1. Rodrigues B, McNeill JH. The diabetic heart: metabolic causes for the development of cardiomyopathy. Cardiovasc Res. 1992;26:913–22. - PubMed
    1. Stanley WC, Lopaschuk GD, McCormack JG. Regulation of energy substrate metabolism in the diabetic heart. Cardiovasc Res. 1997;34:25–33. - PubMed
    1. Huss JM, Kelly DP. Nuclear receptor signaling and cardiac energetics. Circ Res. 2004;95:568–78. - PubMed
    1. Lai L, Leone TC, Zechner C, Schaeffer PJ, Kelly SM, Flanagan DP, et al. Transcriptional coactivators PGC-1alpha and PGC-lbeta control overlapping programs required for perinatal maturation of the heart. Genes Dev. 2008 Jul 15;22(14):1948–61. - PMC - PubMed
    1. Lehman JJ, Barger PM, Kovacs A, Saffitz JE, Medeiros D, Kelly DP. PPAR γ coactivator-1 (PGC-1) promotes cardiac mitochondrial biogenesis. J Clin Invest. 2000;106:847–56. - PMC - PubMed

Publication types

MeSH terms

Substances