. 2012 Jan;22(1):115-24.
doi: 10.1101/gr.121285.111. Epub 2011 Nov 11.

Microbial domestication signatures of Lactococcus lactis can be reproduced by experimental evolution

Affiliations

Microbial domestication signatures of Lactococcus lactis can be reproduced by experimental evolution

Herwig Bachmann et al. Genome Res. 2012 Jan.

Abstract

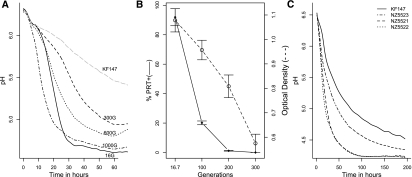
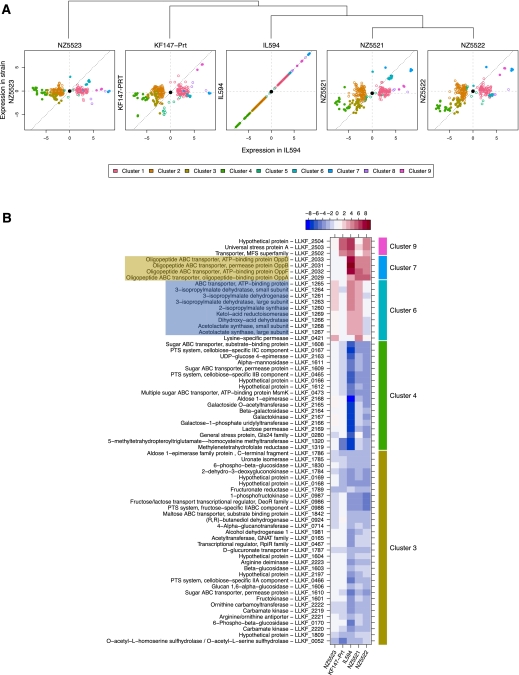
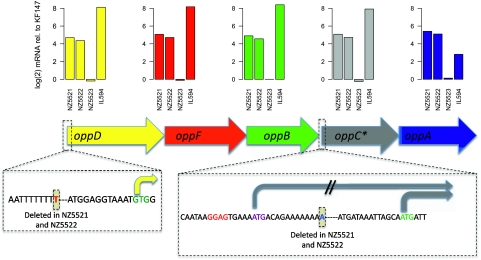
Experimental evolution is a powerful approach to unravel how selective forces shape microbial genotypes and phenotypes. To this date, the available examples focus on the adaptation to conditions specific to the laboratory. The lactic acid bacterium Lactococcus lactis naturally occurs on plants and in dairy environments, and it is proposed that dairy strains originate from the plant niche. Here we investigate the adaptation of a L. lactis strain isolated from a plant to a dairy niche by propagating it for 1000 generations in milk. Two out of three independently evolved strains displayed significantly increased acidification rates and biomass yields in milk. Genome resequencing, revealed six, seven, and 28 mutations in the three strains, including point mutations in loci related to amino acid biosynthesis and transport and in the gene encoding MutL, which is involved in DNA mismatch repair. Two strains lost a conjugative transposon containing genes important in the plant niche but dispensable in milk. A plasmid carrying an extracellular protease was introduced by transformation. Although improving growth rate and growth yield significantly, the plasmid was rapidly lost. Comparative transcriptome and phenotypic analyses confirmed that major physiological changes associated with improved growth in milk relate to nitrogen metabolism and the loss or down-regulation of several pathways involved in the utilization of complex plant polymers. Reproducing the transition from the plant to the dairy niche through experimental evolution revealed several genome, transcriptome, and phenotype signatures that resemble those seen in strains isolated from either niche.


Figures

Figure 1.
Figure 1.
(A) Acidification of milk by the wild-type strain L. lactis KF 147 (long-dashed gray line) and serial propagation of culture SP1 adapted to milk for 16 (solid line), 300 (dashed line), 600 (dotted line), and 1000 (dash-dot line) generations. Acidification profiles are the average of three biological replicates. Standard deviations of the maximum slopes of each curve (calculated over the consecutive measurements of 3 h) were 3.3%, 1.5%, 2.1%, 8.1%, and 6.6% for cultures KF147, 16, 300, 600, and 1000 generations, respectively. (B) Invasion of protease-negative variants during the first 300 generations in milk. The fraction of protease-positive cells (♦, left y-axis), and the final cell density reached (○, right y-axis), during growth in milk decreased throughout the serial propagation of the cultures (x-axis). The averages of three independently propagated cultures (SP1, SP2, and SP3) and standard deviations are shown. (C) Acidification profiles of the wild-type strain KF147 (solid line) and milk adapted single colony isolates NZ5521 (dashed line), NZ5522 (dotted line), and NZ5523 (dash-dot line) grown in milk.
Figure 2.
Figure 2.
Genome-wide gene expression profiles during exponential growth in milk. All strains are compared to the wild-type strain KF147, and log2-transformed expression ratios are displayed. (A) Expression levels of all differentially regulated genes compared to KF147 (p < 0.001 in at least one of the strains) in relation to that of the dairy isolate IL594. Genes that are not differentially expressed with respect to strain KF147 map on the center of the plot (•). Expression levels of genes falling either in the bottom left or the top right quadrant show transcript changes toward the levels found in IL594. Genes falling in the top left or bottom right quadrant show changes in the opposite direction compared with IL594. Transcript levels similar to those found in the dairy isolate are identified as dots close to the diagonal of the plot (dotted line). The tree at the top of panel A summarizes the similarity of gene expression between the strains. (B) The differential gene expression in detail for the five most discriminating clusters. Only genes of clusters with an average differential expression of at least fourfold in at least one of the three evolved strains are plotted (corresponding to solid symbols in panel A). Gene functional annotations and identifiers are listed. Brown and blue shading indicates genes/putative operons containing point mutations in the upstream promoter region in at least one of the adapted strains. The heat map on the top of panel B displays the log2-transformed differential expression levels.
Figure 3.
Figure 3.
Expression profiles of the opp-operon encoding an oligopeptide ABC-transport system. The bar-plots at the top of the figure display transcript levels of the indicated strains as compared with strain KF147. The deletion of a thymidine residue 64 bases upstream of the GTG-start codon of oppD in strains NZ5521 and NZ5522 is likely to explain the higher expression levels in these strains. In the same two strains, the deletion of an adenine residue (blue) in the upstream region of the truncated oppC gene generates an (alternative) start codon (purple), which is located 78 bases upstream of the native oppC start codon (green) and is preceded by a typical lactococcal ribosome binding site (red) that appears to be absent upstream of the native start codon. (*) Microarray probes designed to detect oppC are not 100% matching to the sequence of strain IL594—the actual expression level of oppC in strain IL594 might therefore be higher than indicated.

References

    1. Bachmann H, de Wilt L, Kleerebezem M, van Hylckama Vlieg JE 2010. Time-resolved genetic responses of Lactococcus lactis to a dairy environment. Environ Microbiol 12: 1260–1270 - PubMed
    1. Bachmann H, Molenaar D, Kleerebezem M, van Hylckama Vlieg JE 2011. High local substrate availability stabilizes a cooperative trait. ISME J 5: 929–932 - PMC - PubMed
    1. Barrick JE, Yu DS, Yoon SH, Jeong H, Oh TK, Schneider D, Lenski RE, Kim JF 2009. Genome evolution and adaptation in a long-term experiment with Escherichia coli. Nature 461: 1243–1247 - PubMed
    1. Bartkus JM, Tyler B, Calvo JM 1991. Transcription attenuation-mediated control of leu operon expression: Influence of the number of Leu control codons. J Bacteriol 173: 1634–1641 - PMC - PubMed
    1. Beaumont HJ, Gallie J, Kost C, Ferguson GC, Rainey PB 2009. Experimental evolution of bet hedging. Nature 462: 90–93 - PubMed

MeSH terms

LinkOut - more resources