. 2011 Nov;23(11):4065-78.
doi: 10.1105/tpc.111.087866. Epub 2011 Nov 11.

Transcriptional regulation of Arabidopsis LEAFY COTYLEDON2 involves RLE, a cis-element that regulates trimethylation of histone H3 at lysine-27

Affiliations

Transcriptional regulation of Arabidopsis LEAFY COTYLEDON2 involves RLE, a cis-element that regulates trimethylation of histone H3 at lysine-27

Nathalie Berger et al. Plant Cell. 2011 Nov.

Abstract

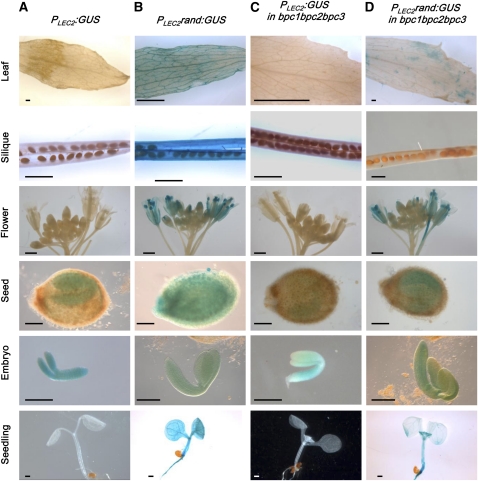
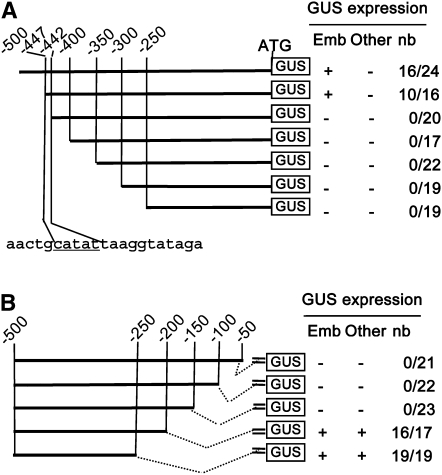
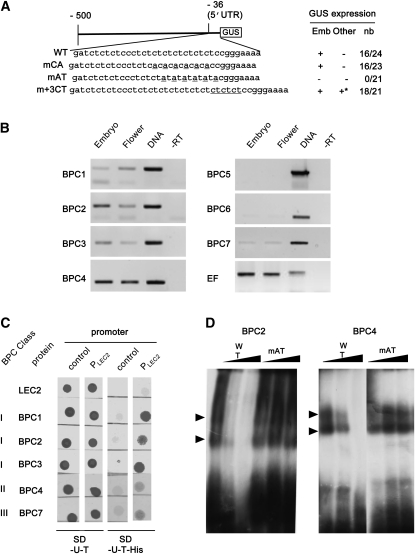
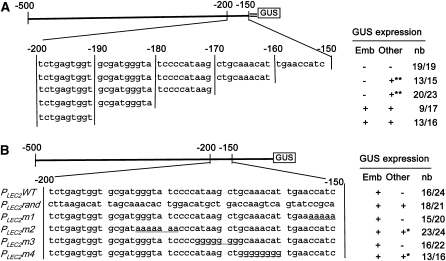
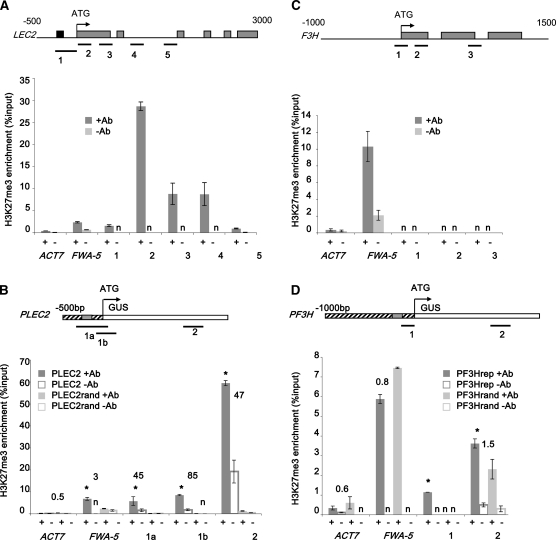
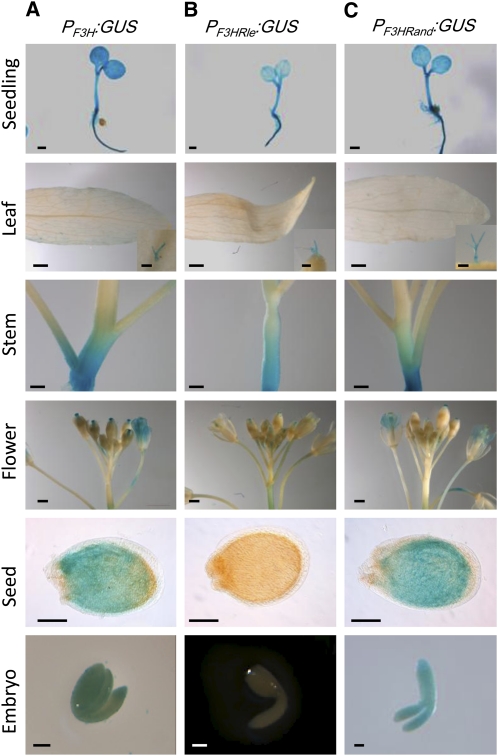
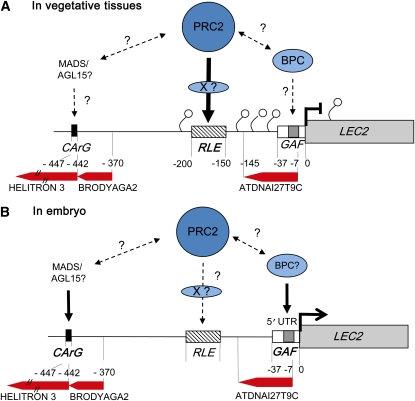
LEAFY COTYLEDON2 (LEC2) is a master regulator of seed development in Arabidopsis thaliana. In vegetative organs, LEC2 expression is negatively regulated by Polycomb Repressive Complex2 (PRC2) that catalyzes histone H3 Lys 27 trimethylation (H3K27me3) and plays a crucial role in developmental phase transitions. To characterize the cis-regulatory elements involved in the transcriptional regulation of LEC2, molecular dissections and functional analyses of the promoter region were performed in vitro, both in yeast and in planta. Two cis-activating elements and a cis-repressing element (RLE) that is required for H3K27me3 marking were characterized. Remarkably, insertion of the RLE cis-element into pF3H, an unrelated promoter, is sufficient for repressing its transcriptional activity in different tissues. Besides improving our understanding of LEC2 regulation, this study provides important new insights into the mechanisms underlying H3K27me3 deposition and PRC2 recruitment at a specific locus in plants.


Figures

Figure 1.
Figure 1.
Expression Patterns Using the Wild Type and Mutated LEC2 Promoter. Representative GUS patterns are presented for PLEC2:GUS (A) and PLEC2rand:GUS (B) in the wild-type Columbia-0 background and for PLEC2:GUS (C) and PLEC2rand:GUS (D) in the bpc1 bpc2 bpc3 triple mutant background, respectively. Bars = 1 mm in leaf, silique, and flower, and 0.1 mm in seed, embryo, and seedling. Independent transgenic lines (n > 12 for each construct) were assayed for GUS activity in leaves, siliques, flowers, seeds, embryos, and seedlings (10 d after sowing).
Figure 2.
Figure 2.
Molecular Dissection Analysis of the LEC2 Promoter. Schematic representation of the deletion series of the LEC2 promoter (PLEC2) fused to the GUS reporter gene. The presence or lack of GUS expression is indicated by (+) or (–), respectively. The ratio (nb) indicates the number of transgenic lines expressing GUS (numerator) and the total number of transgenic lines analyzed (denominator). GUS expression was tested in embryos (emb), valves of siliques, flowers, rosettes, cauline leaves, and stems (other). (A) The 5′-end deletions. The nucleotide sequence underlined is essential for PLEC2 activity. (B) The 3′-end deletions were fused to a minimal promoter derived from the 35S of the cauliflower mosaic virus (=).
Figure 3.
Figure 3.
The Promoter of LEC2 Contains a CT-Rich Repeat Bound by BPC Proteins. (A) The wild-type (WT) PLEC2 sequence is shown in the top row (WT). Mutated nucleotides are underlined in the next three rows (mCA, mAT, and m+3CT). GUS activity in pollen is indicated with an asterisk. Presence or lack of GUS expression is indicated by (+) or (–), respectively. The ratio (nb) indicates the number of transgenic lines expressing GUS (numerator) and the total number of transgenic lines analyzed (denominator). GUS expression was tested in embryos (emb), valves of siliques, flowers, rosettes, cauline leaves, and stems (other). UTR, untranslated region. (B) Analysis of BPC expression in embryos and flowers. Genomic DNA, embryo RNA untreated by the superscript II enzyme (-RT), and EF1αA4 (EF) were used as control. (C) One-hybrid analysis. The interactions of the different full-length BPC proteins, fused to GAL4, with PLEC2 were tested. The ability to grow in the absence of His indicates an interaction. (D) EMSA competition assays. BPC2 and BPC4 proteins were tested with labeled wild-type CT repeat probe, and competitions were performed with wild-type or mutated CT repeat (mAT) unlabeled probes. Shifts are indicated with arrowheads.
Figure 4.
Figure 4.
Molecular Dissection Analysis of the RLE Domain. Presence or absence of GUS activity is indicated by (+) or (–), respectively. The ratio to the right (nb) indicates the number of transgenic lines that display GUS activity (numerator) and the total number of transgenic lines analyzed (denominator). GUS activity was tested in embryos (emb), valves of siliques, flowers, rosettes, cauline leaves, and stems (other). The detection of GUS activity in pollen (+*) or in all organs with the exception of the seed coat and embryo (+**) is indicated. (A) Analysis using 3′-end deletion constructs fused to the minimal 35S promoter (=) and to the GUS reporter gene. (B) Analysis using modifications of the RLE domain by replacement with a random 50-bp sequence (PLEC2rand) or by site-directed mutagenesis (PLEC2m1, m2, m3, and m4).
Figure 5.
Figure 5.
ChIP-PCR Analysis of H3K27me3 Enrichment over the Endogenous and Transgenic LEC2 and F3H Loci. The H3K27me3 enrichments in 10-d-old seedlings at LEC2 (A), PLEC2:GUS (B), F3H (C), and PF3H:GUS (D) loci are presented. The enrichment is expressed relative to chromatin input (%input). All the experiments were repeated at least twice on a pool of five independent transgenic lines. ACT7 and FWA genes were used as negative and positive controls, respectively. Bars denote se, and n = not detectable. For (A) and (C), the positions of the primers used (thick lines), RLE element (black box), introns (thin line), and exons (dark boxes) are indicated on the top. For (B) and (D), the positions of the primers (thick lines), LEC2 promoter (striped box), RLE element (dark box), and GUS coding sequence (white box) are indicated on the top. The numbers above the histogram bars represent the ratio of the H3K27me3 enrichment when comparing constructs with and without the RLE element (i.e., PLEC2 with PLEC2Rand [B] and PF3Hrle with PF3HRand [D]). The asterisks indicate that the difference (with or without RLE) is significant at P < 0.002 according to Student’s unpaired t test.
Figure 6.
Figure 6.
Insertion of the RLE Element Inhibits PF3H Activity in Seed. Representative patterns of GUS staining are presented for PF3H:GUS (A), PF3Hrle:GUS (B), and PF3Hrand:GUS (C). Independent transgenic lines (n = 24 for each construct) were analyzed for GUS activity in seedling, leaf, trichome, stem, flower, seed, and embryo. Bars = 1 mm for seedling, leaf, and flower and 0.1 mm for trichome, seed, and embryo.
Figure 7.
Figure 7.
Schematic Structure and Regulation of the LEC2 Promoter. Putative model of regulation in vegetative tissues (A) and in the embryo (B). The CArG box, GAF box, and RLE element are represented as well as the transposon marks (MuDR and HEL:Helitron) and putative functional interactions between the proteins. Small circles represent H3K27me3 marks.

References

    1. Adkins N.L., Hagerman T.A., Georgel P. (2006). GAGA protein: A multi-faceted transcription factor. Biochem. Cell Biol. 84: 559–567 - PubMed
    1. Aichinger E., Villar C.B., Di Mambro R., Sabatini S., Köhler C. (2011). The CHD3 chromatin remodeler PICKLE and polycomb group proteins antagonistically regulate meristem activity in the Arabidopsis root. Plant Cell 23: 1047–1060 - PMC - PubMed
    1. Aichinger E., Villar C.B., Farrona S., Reyes J.C., Hennig L., Köhler C. (2009). CHD3 proteins and polycomb group proteins antagonistically determine cell identity in Arabidopsis. PLoS Genet. 5: e1000605. - PMC - PubMed
    1. Badis G., et al. (2009). Diversity and complexity in DNA recognition by transcription factors. Science 324: 1720–1723 - PMC - PubMed
    1. Baroux C., Gagliardini V., Page D.R., Grossniklaus U. (2006). Dynamic regulatory interactions of Polycomb group genes: MEDEA autoregulation is required for imprinted gene expression in Arabidopsis. Genes Dev. 20: 1081–1086 - PMC - PubMed

Publication types

MeSH terms

LinkOut - more resources