

β2-Adrenoceptor agonist-induced RGS2 expression is a genomic mechanism of bronchoprotection that is enhanced by glucocorticoids
- PMID: 22080612
- PMCID: PMC3241812
- DOI: 10.1073/pnas.1110226108
β2-Adrenoceptor agonist-induced RGS2 expression is a genomic mechanism of bronchoprotection that is enhanced by glucocorticoids
Abstract
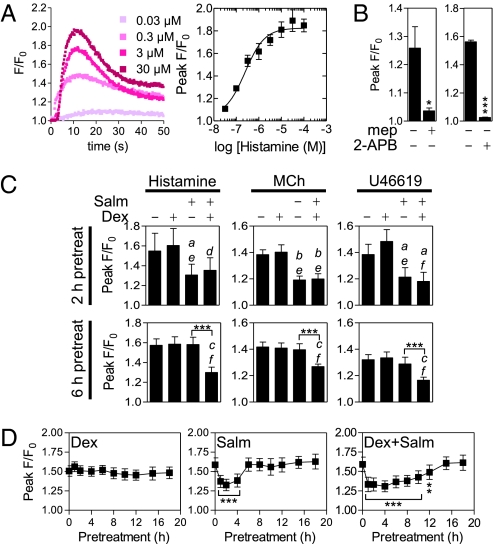
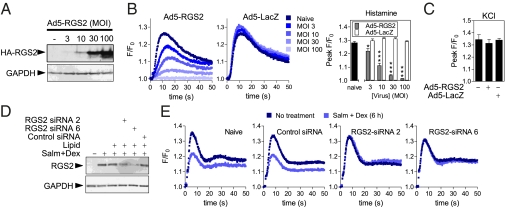
In asthma and chronic obstructive pulmonary disease, activation of G(q)-protein-coupled receptors causes bronchoconstriction. In each case, the management of moderate-to-severe disease uses inhaled corticosteroid (glucocorticoid)/long-acting β(2)-adrenoceptor agonist (LABA) combination therapies, which are more efficacious than either monotherapy alone. In primary human airway smooth muscle cells, glucocorticoid/LABA combinations synergistically induce the expression of regulator of G-protein signaling 2 (RGS2), a GTPase-activating protein that attenuates G(q) signaling. Functionally, RGS2 reduced intracellular free calcium flux elicited by histamine, methacholine, leukotrienes, and other spasmogens. Furthermore, protection against spasmogen-increased intracellular free calcium, following treatment for 6 h with LABA plus corticosteroid, was dependent on RGS2. Finally, Rgs2-deficient mice revealed enhanced bronchoconstriction to spasmogens and an absence of LABA-induced bronchoprotection. These data identify RGS2 gene expression as a genomic mechanism of bronchoprotection that is induced by glucocorticoids plus LABAs in human airway smooth muscle and provide a rational explanation for the clinical efficacy of inhaled corticosteroid (glucocorticoid)/LABA combinations in obstructive airways diseases.
Conflict of interest statement
The authors declare no conflict of interest.
Figures


Similar articles
-
Induction of regulator of G-protein signaling 2 expression by long-acting β2-adrenoceptor agonists and glucocorticoids in human airway epithelial cells.J Pharmacol Exp Ther. 2014 Jan;348(1):12-24. doi: 10.1124/jpet.113.204586. Epub 2013 Oct 25. J Pharmacol Exp Ther. 2014. PMID: 24163441
-
Formoterol and salmeterol induce a similar degree of β2-adrenoceptor tolerance in human small airways but via different mechanisms.Br J Pharmacol. 2011 Jun;163(3):521-32. doi: 10.1111/j.1476-5381.2011.01257.x. Br J Pharmacol. 2011. PMID: 21306583 Free PMC article.
-
Superiority of combined phosphodiesterase PDE3/PDE4 inhibition over PDE4 inhibition alone on glucocorticoid- and long-acting β2-adrenoceptor agonist-induced gene expression in human airway epithelial cells.Mol Pharmacol. 2015 Jan;87(1):64-76. doi: 10.1124/mol.114.093393. Epub 2014 Oct 16. Mol Pharmacol. 2015. PMID: 25324049
-
Clinical safety of long-acting beta2-agonist and inhaled corticosteroid combination therapy in COPD.COPD. 2006 Aug;3(3):163-71. doi: 10.1080/15412550600830263. COPD. 2006. PMID: 17240618 Review.
-
Understanding how long-acting β2 -adrenoceptor agonists enhance the clinical efficacy of inhaled corticosteroids in asthma - an update.Br J Pharmacol. 2016 Dec;173(24):3405-3430. doi: 10.1111/bph.13628. Epub 2016 Nov 9. Br J Pharmacol. 2016. PMID: 27646470 Free PMC article. Review.
Cited by
-
Synergistic Enhancement of Isoforskolin and Dexamethasone Against Sepsis and Acute Lung Injury Mouse Models.J Inflamm Res. 2023 Dec 7;16:5989-6001. doi: 10.2147/JIR.S421232. eCollection 2023. J Inflamm Res. 2023. PMID: 38088941 Free PMC article.
-
Pharmacologic rationale, efficacy and safety of the fixed-dose co-formulation of indacaterol and glycopyrronium.Multidiscip Respir Med. 2014 Dec 8;9(1):64. doi: 10.1186/2049-6958-9-64. eCollection 2014. Multidiscip Respir Med. 2014. PMID: 25699181 Free PMC article. Review.
-
Long-Acting β2-Adrenoceptor Agonists Enhance Glucocorticoid Receptor (GR)-Mediated Transcription by Gene-Specific Mechanisms Rather Than Generic Effects via GR.Mol Pharmacol. 2018 Sep;94(3):1031-1046. doi: 10.1124/mol.118.112755. Epub 2018 Jun 29. Mol Pharmacol. 2018. PMID: 29959223 Free PMC article.
-
RGS proteins, GRKs, and beta-arrestins modulate G protein-mediated signaling pathways in asthma.Pharmacol Ther. 2021 Jul;223:107818. doi: 10.1016/j.pharmthera.2021.107818. Epub 2021 Feb 15. Pharmacol Ther. 2021. PMID: 33600853 Free PMC article. Review.
-
RGS2 is an innate immune checkpoint for suppressing Gαq-mediated IFNγ generation and lung injury.iScience. 2025 Jan 27;28(2):111878. doi: 10.1016/j.isci.2025.111878. eCollection 2025 Feb 21. iScience. 2025. PMID: 40041768 Free PMC article.
References
-
- Bateman ED, et al. Global strategy for asthma management and prevention: GINA executive summary. Eur Respir J. 2008;31:143–178. - PubMed
-
- Rabe KF, et al. Global Initiative for Chronic Obstructive Lung Disease Global strategy for the diagnosis, management, and prevention of chronic obstructive pulmonary disease: GOLD executive summary. Am J Respir Crit Care Med. 2007;176:532–555. - PubMed
-
- Newton R, Leigh R, Giembycz MA. Pharmacological strategies for improving the efficacy and therapeutic ratio of glucocorticoids in inflammatory lung diseases. Pharmacol Ther. 2010;125:286–327. - PubMed
-
- Barnes PJ. Immunology of asthma and chronic obstructive pulmonary disease. Nat Rev Immunol. 2008;8:183–192. - PubMed
Publication types
MeSH terms
Substances
Grants and funding
LinkOut - more resources
Full Text Sources
Other Literature Sources
Medical
Molecular Biology Databases
