. 2011 Dec;121(12):4758-74.
doi: 10.1172/JCI59492. Epub 2011 Nov 14.

T cell protein tyrosine phosphatase attenuates T cell signaling to maintain tolerance in mice

Affiliations

T cell protein tyrosine phosphatase attenuates T cell signaling to maintain tolerance in mice

Florian Wiede et al. J Clin Invest. 2011 Dec.

Erratum in

Abstract

Many autoimmune diseases exhibit familial aggregation, indicating that they have genetic determinants. Single nucleotide polymorphisms in PTPN2, which encodes T cell protein tyrosine phosphatase (TCPTP), have been linked with the development of several autoimmune diseases, including type 1 diabetes and Crohn's disease. In this study, we have identified TCPTP as a key negative regulator of TCR signaling, which might explain the association of PTPN2 SNPs with autoimmune disease. We found that TCPTP dephosphorylates and inactivates Src family kinases to regulate T cell responses. Using T cell-specific TCPTP-deficient mice, we established that TCPTP attenuates T cell activation and proliferation in vitro and blunts antigen-induced responses in vivo. TCPTP deficiency lowered the in vivo threshold for TCR-dependent CD8(+) T cell proliferation. Consistent with this, T cell-specific TCPTP-deficient mice developed widespread inflammation and autoimmunity that was transferable to wild-type recipient mice by CD8(+) T cells alone. This autoimmunity was associated with increased serum levels of proinflammatory cytokines and anti-nuclear antibodies, T cell infiltrates in non-lymphoid tissues, and liver disease. These data indicate that TCPTP is a critical negative regulator of TCR signaling that sets the threshold for TCR-induced naive T cell responses to prevent autoimmune and inflammatory disorders arising.


Figures

Figure 1
Figure 1. Generation of Lck-Cre;Ptpn2fl/fl mice.
(A) Ptpn2 genomic locus and targeting design. (B) Southern blot and PCR analysis of wild-type and Ptpn2 floxed mice. (C) TCPTP expression in Ptpn2fl/fl (fl/fl) and Lck-Cre;Ptpn2fl/fl (Lck-Cre; fl/fl) thymocytes (Thy), FACS-purified CD8+SP thymocytes, and CD4+ or CD8+ LN naive T cells and MACS purified CD19+ splenic B cells, as well as bone marrow–derived macrophages (BMDMs). Results are representative of at least 3 independent experiments.
Figure 2
Figure 2. Thymocyte development in Lck-Cre;Ptpn2fl/fl mice.
Ptpn2fl/fl and Lck-Cre;Ptpn2fl/fl thymocytes from 4-week-old mice were stained with fluorochrome-conjugated α-CD4, -CD8, -TCRβ, -CD69, and -CD5 and analyzed by flow cytometry. (A) Representative dot blots (numbers in outlined areas are percentages of cells in gate) and results from 3 experiments are shown. (B) Cells were gated for the different developmental stages (labeled 1–4) according to the expression of the positive selection markers CD69, CD5, and TCRβ, and absolute numbers were determined. Representative dot blots and results from 3 experiments are shown. (C) Thymocytes from OT-II TCR transgenic Ptpn2fl/fl (OT-II;Ptpn2fl/fl) and Lck-Cre;Ptpn2fl/fl (OT-II;Lck-Cre;Ptpn2fl/fl) mice were stained with fluorochrome-conjugated α-CD4 and α-CD8 and analyzed by flow cytometry. Cells were gated for the DP and CD4+SP stages, and absolute numbers and the indicated ratios were determined. Representative dot plots (numbers in outlined areas are percentages of cells in gate) and results from 2 independent experiments are shown. Results in AC are mean ± SEM for the indicated numbers of mice; significance was determined using a 2-tailed Mann-Whitney U test; *P < 0.05, **P < 0.01, ***P < 0.001.
Figure 3
Figure 3. T cell subsets in Lck-Cre;Ptpn2fl/fl mice.
Ptpn2fl/fl and Lck-Cre;Ptpn2fl/fl lymphocytes isolated from LNs, spleen, and liver of 7-week-old mice were stained with fluorochrome-conjugated antibodies against CD4, CD8, TCRβ, CD44, and CD62L and analyzed by flow cytometry. Absolute numbers of total CD4+TCRβ+ or CD8+TCRβ+ T cells and CD4+ versus CD8+ naive (CD44loCD62Lhi) and effector/memory-like (E/M) (CD44hiCD62Llo) T cells were determined. Representative dot plots (numbers in outlined areas are percentages of cells in gate) and results from 2 independent experiments are shown. Results shown are mean ± SEM for the indicated number of mice; significance was determined using 2-tailed Mann-Whitney U test; *P < 0.05, **P < 0.01.
Figure 4
Figure 4. Lck and Fyn but not ZAP-70 can serve as TCPTP substrates.
COS1 cells were transfected with vector control or constructs for 45-kDa TCPTP or TCPTP-D182A and (A and C) Lck or Lck-Y505F, (B) Fyn, or (D) ZAP-70. (A, B, and D) Cell lysates or (C) TCPTP immunoprecipitates were resolved by SDS-PAGE and immunoblotted for p-(Y418) SFK or p-(Y493) ZAP-70 and then reprobed as indicated. Lck species with retarded electrophoretic mobility resulting from TCPTP-D182A expression are indicated by arrows. (EG) Jurkat E6.1 T cells transfected with vector control or constructs for TCPTP or TCPTP-D182A were stimulated by crosslinking with mouse α–human CD3ε at 37°C for the indicated times. (E and G) Cell lysates and (F) Lck immunoprecipitates were resolved by SDS-PAGE and immunoblotted for p-(Y418) SFK or antibodies specific for phosphorylated and activated ERK1/2 (p-ERK1/2) and reprobed as indicated. Retarded p-(Y418) SFK species indicative of Lck activation and p-ERK1 and p-ERK2 as well as the IgG heavy chain (IgGHC) are highlighted by arrows. Results shown are representative of 3 independent experiments.
Figure 5
Figure 5. Ptpn2 deletion enhances TCR signaling.
(AD) MACS-purified (Miltenyi Biotec) CD8+SP thymocytes or (E) FACS-purified LN naive (CD44lo) CD8+ T cells or OT-I LN naive CD8+ T cells from Ptpn2fl/fl and Lck-Cre;Ptpn2fl/fl mice were stimulated with α-CD3ε at 37°C for the indicated times. Cell lysates or Lck immunoprecipitates were resolved by SDS-PAGE and immunoblotted for p-(Y418) SFK, p-(Y394) Lck, or p-ERK1/2 and then reprobed with actin as indicated. Retarded p-(Y418) SFK and p-(Y394) Lck species and p-ERK1 and p-ERK2 as well as IgGHC are indicated by arrows. Results shown are representative of at least 3 independent experiments. In AC, electrophoretically retarded p-(Y418) SFK and p-(Y394) Lck species and p-ERK2 were quantified by densitometric analysis and normalized for actin or ERK2 as indicated. In A, data are shown as arbitrary units (AU). Quantified results are mean ± SEM for the indicated number of independent experiments; significance was determined using 2-tailed Mann-Whitney U test; *P < 0.05, **P < 0.01.
Figure 6
Figure 6. Ptpn2 deletion enhances thymocyte proliferation and T cell activation in vitro.
(A) Ptpn2fl/fl and Lck-Cre;Ptpn2fl/fl total thymocytes or FACS-purified Ptpn2fl/fl and Lck-Cre;Ptpn2fl/fl or Ptpn2fl/+ and Lck-Cre;Ptpn2fl/+ CD8+SP thymocytes from 4-week-old mice were stimulated with plate-bound α-CD3ε with or without α-CD28 or PMA (1 ng/ml) plus ionomycin (Ion; 200 ng/ml), and proliferation was determined by [3H]thymidine incorporation. Results are mean ± SD from quadruplicate determinations and are representative of at least 3 independent experiments. (B) FACS-purified CD4+ naive (CD25loCD44loCD62hi) or CD8+ (CD44loCD62hi) LN T cells (2 × 10⁵) from 4-week-old Ptpn2fl/fl and Lck-Cre;Ptpn2fl/fl mice were stimulated with plate-bound α-CD3ε (5 μg/ml) and α-CD28 (2.5 μg/ml) for 48 hours. Photographs were taken and cells harvested and stained with fluorochrome-conjugated antibodies against CD44, CD69, CD25, and CD122. Cells were analyzed by flow cytometry and the indicated MFI determined; data are shown as arbitrary units (AU), and significance was determined using 2-tailed Mann-Whitney U test; *P < 0.05. Representative photographs, forward scatter (FSC) plots, and results from 2 independent experiments are shown. Scale bars: 1 mm.
Figure 7
Figure 7. Ptpn2 deletion enhances T cell proliferation in vitro.
(A and B) FACS-purified CD8+ (CD44lo) or CD4+ naive (CD25loCD44lo) LN T cells from 4-week-old Ptpn2fl/fl and Lck-Cre;Ptpn2fl/fl mice were stained with CFSE and stimulated with plate-bound α-CD3ε with or without α-CD28 (2.5 μg/ml) for 72 hours. Representative profiles from 3 independent experiments are shown. (C) FACS-purified Ptpn2fl/fl and Lck-Cre;Ptpn2fl/fl CD4+ naive (CD25loCD44lo) LN T cells from 4-week-old mice were stimulated with plate-bound α-CD3ε with or without α-CD28 for 48 hours, and proliferation was determined by [3H]thymidine incorporation. Results are mean ± SD from triplicate determinations and are representative of 3 independent experiments.
Figure 8
Figure 8. Ptpn2 deletion enhances T cell proliferation in vivo.
(A) FACS-purified CD8+ naive LN T cells from 4-week-old OT-I;Ptpn2fl/fl and OT-I;Lck-Cre;Ptpn2fl/fl mice were stained with CFSE and transferred into syngeneic hosts, which were immunized 24 hours later with vehicle control (PBS) or 2.5 μg SIINFEKL. Forty-eight hours after immunization LN, splenic, and liver T cells were isolated and stained with fluorochrome-conjugated antibodies against CD8 and TCRvα2 and CD8+ T cells analyzed by flow cytometry. Representative profiles (numbers are percentages of cells that have undergone >3 divisions) are shown; PBS controls are shown in black. Quantified results are mean ± SEM (pooled cells from 2 donors transferred into 5 recipients in each case) and are representative of 3 independent experiments; significance was determined using 2-tailed Mann-Whitney U test; *P < 0.05, **P < 0.01. (B) FACS-purified CD4+ naive LN T cells from 4 -week-old OT-II;Ptpn2fl/fl and OT-II;Lck-Cre;Ptpn2fl/fl mice were stained with CFSE and transferred into syngeneic hosts and 24 hours later immunized with OVA. Seventy-two hours after immunization, splenic T cells were isolated and stained with fluorochrome-conjugated antibodies against CD4 and TCRvα2 and CD4+ T cells analyzed by flow cytometry. Representative profiles (numbers are percentages of cells that have undergone >4 divisions) are shown. Quantified results are mean ± SEM (cells from 3 donors transferred into 2 recipients in each case and stimulated with 25 or 50 μg OVA) and are representative of 3 independent experiments; significance was determined using a 2-tailed Student’s t test; *P < 0.05.
Figure 9
Figure 9. Ptpn2 deletion lowers the threshold for CD8+ T cell proliferation.
(A) FACS-purified CD8+ naive LN T cells from 4-week-old OT-I;Ptpn2fl/fl and OT-I;Lck-Cre;Ptpn2fl/fl mice were stained with CFSE and incubated with the indicated concentrations of SIINFEKL (N4), SIYNFEKL (Y3), or SIIQFEKL (Q4) for 48 hours and analyzed by flow cytometry. Representative profiles from 3 independent experiments are shown. (B) FACS-purified CD8+ naive LN T cells from 4-week-old OT-I;Ptpn2fl/fl and OT-I;Lck-Cre;Ptpn2fl/fl mice were stained with CFSE and transferred into syngeneic hosts and immunized with 1.25 μg N4 or Y3. At 72 hours after immunization, peripheral LN T cells were isolated and stained with fluorochrome-conjugated antibodies against CD8 and TCRvα2 and CD8+ T cells analyzed by flow cytometry. Representative dot plots (numbers are percentages of cells in gate), CFSE profiles (numbers are percentages of cells that have undergone >3 divisions), and quantified results are shown. Quantified results are mean ± SEM (from 3 donors transferred into 2 recipients in each case and stimulated with N4 versus Y3) and are representative of at least 3 independent experiments; significance was determined using 2-tailed Student’s t test; ***P < 0.001.
Figure 10
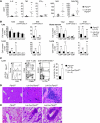
Figure 10. Inflammation and lymphocytic infiltrates in Lck-Cre;Ptpn2fl/fl mice.
(A) Cytokine levels in serum from 48-week-old Ptpn2fl/fl and Lck-Cre;Ptpn2fl/fl mice were determined by flow cytometry using a BD Cytokine Bead Array (BD Biosciences). (B and C) Ptpn2fl/fl and Lck-Cre;Ptpn2fl/fl lymphocytes (3 × 10⁶) isolated from LNs, bone marrow, liver, and lung of 40-week-old mice were stained with fluorochrome-conjugated antibodies against CD4, CD8, CD44, CD62L, KLRG1, and IL-7Rα and analyzed by flow cytometry. (B) Absolute numbers of total CD4+ or CD8+ T cells and CD4+ versus CD8+ naive (CD44loCD62Lhi) and effector/memory-like (CD44hiCD62Llo) T cells were determined. (C) The relative numbers of KLRG1hiIL-7Rαlo CD8+ effector/memory T cells (CD44hiCD62Llo) and representative FACS plots are shown. Formalin-fixed (D) liver sections from 48-week-old mice or (E) lung sections from 40-week-old mice were stained with hematoxylin and eosin. Representative images are shown from 2 independent experiments. Scale bars: 200 μM, low magnification; 100 μM, high magnification. Results shown in AC are mean ± SEM for the indicated number of mice and are representative of at least 2 independent experiments; significance was determined using 2-tailed Mann-Whitney U test; *P < 0.05, **P < 0.01.
Figure 11
Figure 11. ANAs and organ damage in Lck-Cre;Ptpn2fl/fl mice.
(A) Serum ANAs in 40-week-old Ptpn2fl/fl and Lck-Cre;Ptpn2fl/fl mice were measured using a mouse ANA Ig’s (total IgA+G+M) ELISA Kit. (B) Body weights of 40-week-old Ptpn2fl/fl and Lck-Cre;Ptpn2fl/fl mice. (C) Formalin-fixed liver sections from 48-week-old mice were stained with picrosirius red. Representative images are shown. Scale bars: 200 μM. (D) Serum ALT and AST activities in 48-week-old Ptpn2fl/fl and Lck-Cre;Ptpn2fl/fl mice were determined using a Transaminase CII kit. (E) PBS or FACS-purified CD8+ lymphocytes isolated from the spleens of aged Ptpn2fl/fl and Lck-Cre;Ptpn2fl/fl mice were transferred (2 × 10⁶/recipient) into sublethally irradiated (600 rad) congenic Ly5.1 hosts. Twelve weeks after transfer, serum ANAs were measured, and serum ALT and AST activities were determined. Results shown are means for the indicated number of mice; significance was determined using 2-tailed Mann-Whitney U test; *P < 0.05, **P < 0.01, ***P < 0.001.

Comment in

References

    1. Smith-Garvin JE, Koretzky GA, Jordan MS. T cell activation. Annu Rev Immunol. 2009;27:591–619. doi: 10.1146/annurev.immunol.021908.132706. - DOI - PMC - PubMed
    1. Palacios EH, Weiss A. Function of the Src-family kinases, Lck and Fyn, in T-cell development and activation. Oncogene. 2004;23(48):7990–8000. doi: 10.1038/sj.onc.1208074. - DOI - PubMed
    1. Salmond RJ, Filby A, Qureshi I, Caserta S, Zamoyska R. T-cell receptor proximal signaling via the Src-family kinases, Lck and Fyn, influences T-cell activation, differentiation, and tolerance. Immunol Rev. 2009;228(1):9–22. doi: 10.1111/j.1600-065X.2008.00745.x. - DOI - PubMed
    1. Palmer E, Naeher D. Affinity threshold for thymic selection through a T-cell receptor-co-receptor zipper. Nat Rev Immunol. 2009;9(3):207–213. doi: 10.1038/nri2469. - DOI - PubMed
    1. Kerry SE, et al. Interplay between TCR affinity and necessity of coreceptor ligation: high-affinity peptide-MHC/TCR interaction overcomes lack of CD8 engagement. J Immunol. 2003;171(9):4493–4503. - PMC - PubMed

Publication types

MeSH terms

Substances