. 2011 Nov 13;29(12):1120-7.
doi: 10.1038/nbt.2038.

Single-cell dissection of transcriptional heterogeneity in human colon tumors

Affiliations

Single-cell dissection of transcriptional heterogeneity in human colon tumors

Piero Dalerba et al. Nat Biotechnol. .

Abstract

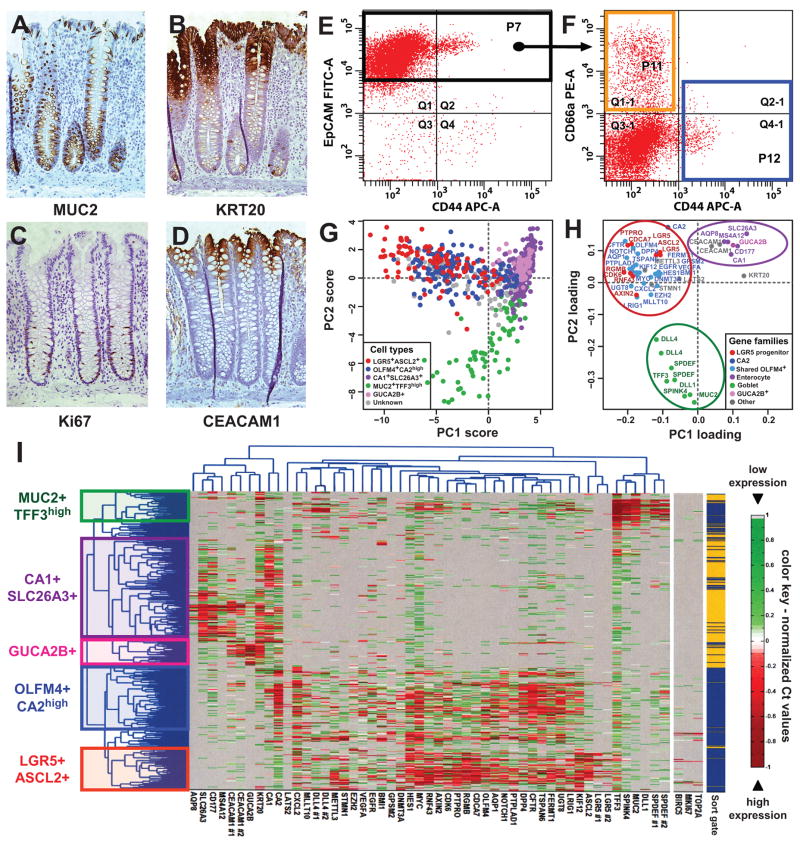
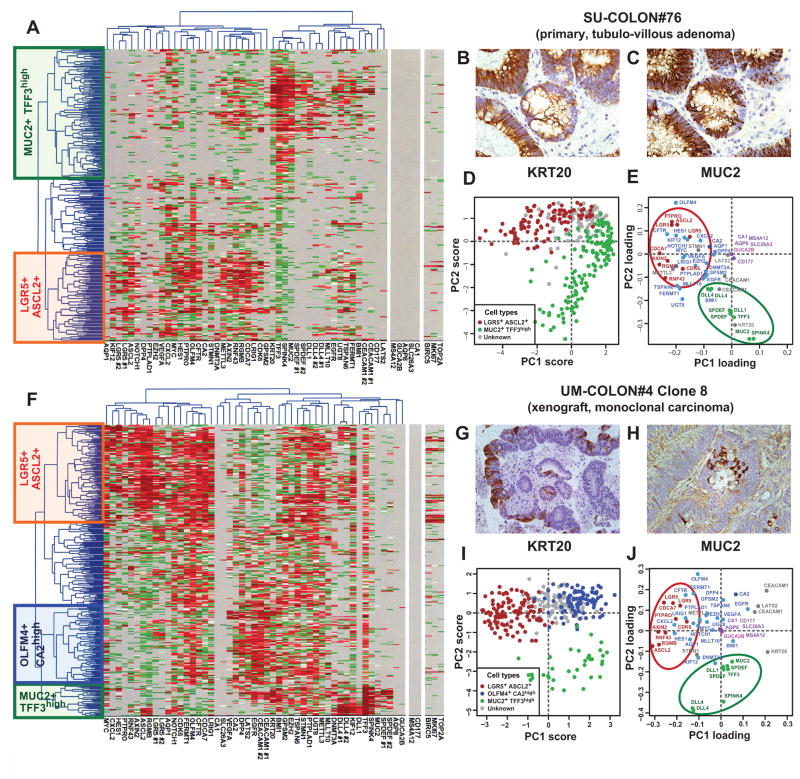
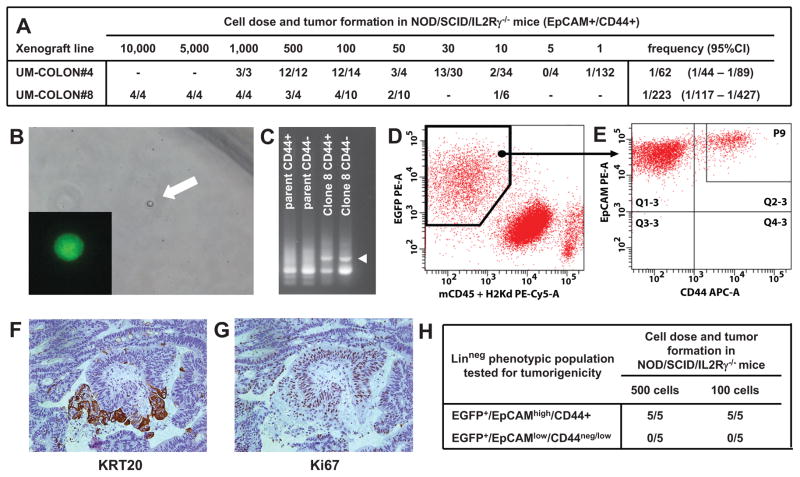
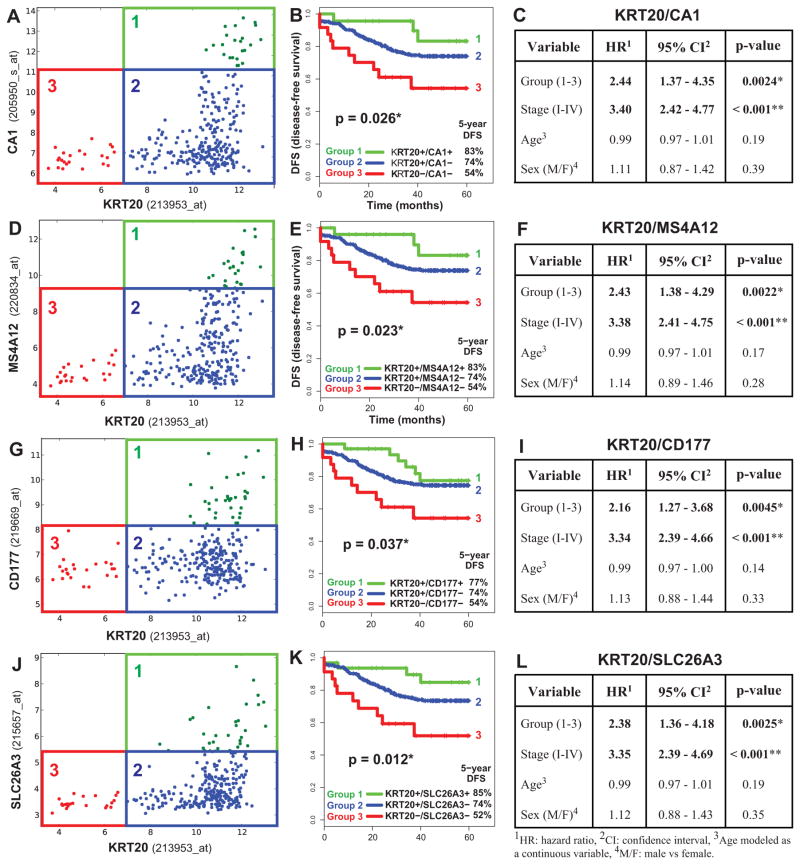
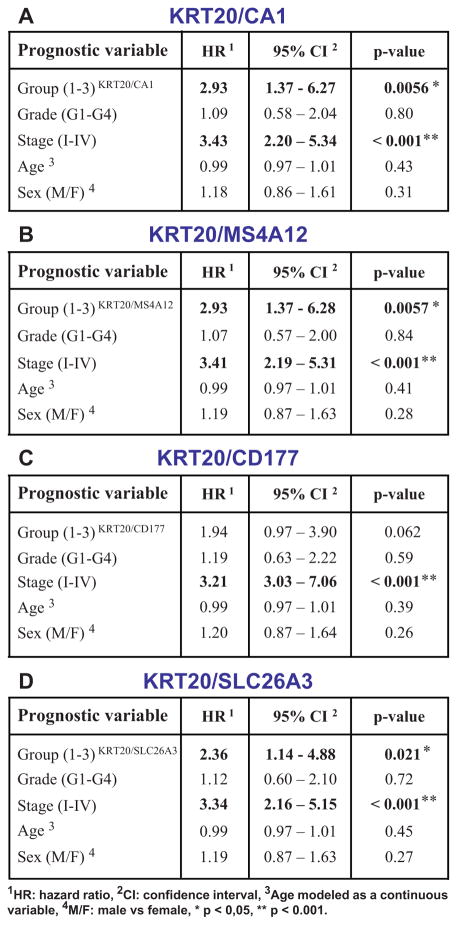
Cancer is often viewed as a caricature of normal developmental processes, but the extent to which its cellular heterogeneity truly recapitulates multilineage differentiation processes of normal tissues remains unknown. Here we implement single-cell PCR gene-expression analysis to dissect the cellular composition of primary human normal colon and colon cancer epithelia. We show that human colon cancer tissues contain distinct cell populations whose transcriptional identities mirror those of the different cellular lineages of normal colon. By creating monoclonal tumor xenografts from injection of a single (n = 1) cell, we demonstrate that the transcriptional diversity of cancer tissues is largely explained by in vivo multilineage differentiation and not only by clonal genetic heterogeneity. Finally, we show that the different gene-expression programs linked to multilineage differentiation are strongly associated with patient survival. We develop two-gene classifier systems (KRT20 versus CA1, MS4A12, CD177, SLC26A3) that predict clinical outcomes with hazard ratios superior to those of pathological grade and comparable to those of microarray-derived multigene expression signatures.


Figures

Figure 1
Figure 1. SINCE-PCR analysis of human normal colon epithelium
Human colon epithelium is composed by a heterogeneous population of cells, which differ in expression of multiple markers, based on their lineage (A, goblet cells express MUC2), differentiation stage (B, “top-of-the-crypt” cells express high levels of KRT20) and proliferative status (C, proliferating cells express Ki67). In the normal colon epithelium, “top-of-the-crypt” and “bottom-of-the-crypt” epithelial cells can be differentially enriched by flow cytometry based of the expression of EpCAM, CD44 and CD66a/CEACAM1 (D–F). “Bottom of the crypt” epithelial cells were defined as EpCAM+/CD44+ (F, P12 blue sort gate) and “top-of-the-crypt” epithelial cells as EpCAM+/CD44neg/CD66ahigh (F, P11 orange sort gate). SINCE-PCR analysis of “top-of-the-crypt” and “bottom-of-the-crypt” normal colon epithelial cells led to the discovery of novel lineage and/or differentiation markers and the establishment of a core set of 57 TaqMan assays that allow the visualization of distinct cell populations, including enterocyte-like cells (CA1+/SLC26A3+ and GUCA2B+), goblet-like cells (MUC2+/TFF3high) and two compartments defined by gene-expression profiles reminiscent of more immature progenitors (OLFM4+/CA2high and LGR5+/ASCL2+) (I). CA1+/SLC26A3+ and GUCA2B+ cells were preferentially observed in the EpCAM+/CD44neg/CD66ahigh population (P11 orange sort gate), while MUC2+/TFF3high, OLFM4+/CA2high and LGR5+/ASCL2+ cells were preferentially observed in the EpCAM+/CD44+ population (P12 blue sort gate). Principal component analysis (PCA) of SINCE-PCR data confirmed hierarchical clustering results, visualizing distinct cell populations characterized by the coordinated expression of independent sets of genes (G–H; PC1: principal component #1, PC2: principal component #2). Both cell populations and gene families identified by PCA closely mirrored those identified by hierarchical clustering.
Figure 2
Figure 2. SINCE-PCR analysis of human colon tumor tissues
Analysis by SINCE-PCR of the EpCAM+/CD44+ population from human colon tumor tissues was performed on a large primary benign adenoma (A, SU-COLON#76) and a monoclonal colon cancer xenograft obtained from injection of a single-cell (n = 1) in a NOD/SCID/IL2Rγ−/− mouse (F, UM-COLON#4 Clone 8). The analysis revealed the presence of multiple cell populations characterized by distinct gene signatures, closely mirroring lineages and differentiation stages observed in the EpCAM+/CD44+ population from the normal colon epithelium. Principal component analysis (PCA) of SINCE-PCR data confirmed hierarchical clustering results, visualizing distinct cell populations characterized by the coordinated expression of independent sets of genes that corresponded to those observed in normal tissues (D–E, SU-COLON#76; I–J, UM-COLON#4 Clone8). Most importantly, the analysis of the monoclonal tumor xenograft obtained from a single-cell indicated that these distinct cell populations, together with their distinctive gene-expression repertoires, did not arise as the result of the coexistence within the tumor tissue of independent genetic sub-clones, but as the result of multi-lineage differentiation processes during tumor growth. SINCE-PCR data were confirmed at the protein level by immunohistochemistry, testing for expression of KRT20 and MUC2 on corresponding tissue sections (B–C, SU-COLON#76; G–H, UM-COLON#4 Clone 8). Color coding of normalized Ct values in hierarchical clustering plots (A, F) and of gene-families in PC loading plots (E–J) are identical to Fig. 1.
Figure 3
Figure 3. Analysis of a monoclonal human colon cancer xenograft obtained from injection of a single-cell (n =1) in NOD/SCID/IL2Rγ−/− mice
In human colon cancer, tumorigenic capacity in immunodeficient mice is enriched in a phenotypic subset of epithelial cancer cells (EpCAMhigh/CD44+). Within the EpCAMhigh/CD44+ population, the number of cells needed to establish a tumor varies based on the individual xenograft line (A), although tumor formation can be obtained even upon injection of very small numbers of cells, including single-cells (B). Monoclonal tumors derived from injection of a single (n = 1), lentivirus-tagged, EGFP+/EpCAMhigh/CD44+ cancer cell from human colon cancer xenograft UM-COLON#4 (B) bear unique lentivirus integration sites as compared to their polyclonal parent tumors (C) and reproduce the diversity of parent tumors both in terms of the phenotypic repertoire of cell populations (D–E) and tissue histology (F, KRT20; G, Ki67). Similar to what observed in parent tumors, EpCAMhigh/CD44+ and EpCAMlow/CD44neg/low populations are characterized by different tumorigenic capacity, as evaluated by tumorigenicity experiments in NOD/SCID/IL2Rγ−/−mice (H).
Figure 4
Figure 4. KRT20 and “top-crypt” genes can be used as novel prognostic markers in colorectal cancer patients
To evaluate whether genes identified by SINCE-PCR as differentially expressed during normal colon differentiation can be used as prognostic markers for colon cancer patients, we analyzed a pooled database of 299 primary colon cancer gene-expression arrays annotated with disease-free survival (DFS) data (Jorissen and Smith, Supplementary Table 1). First, we used the Hegemon software to graph individual arrays according to the expression levels of KRT20 and one of four genes characteristic of “top-of-the-crypt” CA1+/SLC26A3+ enterocyte-like cells (A, CA1; D, MS4A12; G, CD177; J, SLC26A3) and we exploited the StepMiner algorithm to define gene-expression thresholds. In all four instances, three distinct gene-expression groups could be visualized: Group 1 (green), defined as KRT20+/CA1high, KRT20+/MS4A12 high, KRT20+/CD177+ or KRT20+/SLC26A3+, respectively; Group 2 (blue), defined as KRT20+/CA1neg/low, KRT20+/MS4A12neg/low, KRT20+/CD177neg or KRT20+/SLC26A3neg, respectively; Group 3 (red), defined as KRT20neg/CA1neg/low, KRT20neg/MS4A12neg/low, KRT20neg/CD177neg or KRT20neg/SLC26A3neg, respectively. In all instances, an increasingly immature gene-expression profile corresponded to a progressively worse prognosis (B, F, H, K). Multivariate analysis of survival data indicated that the prognostic effect of these “gene-expression groups” is not confounded by clinical stage, age or sex (C, F, I, L; * p < 0.05, ** p < 0.001).
Figure 5
Figure 5. The prognostic effect of “KRT20/top-crypt” gene-expression groups is not confounded by pathological grade and is associated to higher hazard ratios
A direct comparison of the prognostic effect of gene-expression groups identified based on the “KRT20/top-crypt” two-gene scoring system with that of traditional pathological grading, using multivariate analysis based on the Cox proportional hazards model, was performed on a subset database of 181 microarrays annotated with grading information (Smith database, n=181, see Supplementary Table 1). The analysis indicated that the prognostic effect of “KRT20/top-crypt” gene-expression groups is not confounded by and is associated to higher hazard-ratios (HR) as compared to traditional pathological grade, independently of the gene chosen as marker of the “top-of-the-crypt” CA1+/SLC26A3+ enterocyte-type cell population, with the only exception of CD177 (A, CA1; B, MS4A12; C, CD177; D, SLC26A3; * p-value < 0.05, ** p-value < 0.001).

Comment in

References

    1. Reya T, Morrison SJ, Clarke MF, Weissman IL. Stem cells, cancer, and cancer stem cells. Nature. 2001;414:105–111. - PubMed
    1. Jordan CT, Guzman ML, Noble M. Cancer stem cells. N Engl J Med. 2006;355:1253–1261. - PubMed
    1. Dalerba P, Cho RW, Clarke MF. Cancer stem cells: models and concepts. Annu Rev Med. 2007;58:267–284. - PubMed
    1. Shackleton M, Quintana E, Fearon ER, Morrison SJ. Heterogeneity in cancer: cancer stem cells versus clonal evolution. Cell. 2009;138:822–829. - PubMed
    1. Campbell LL, Polyak K. Breast tumor heterogeneity: cancer stem cells or clonal evolution? Cell Cycle. 2007;6:2332–2338. - PubMed

Publication types

MeSH terms