. 2011 Nov 13;30(1):99-104.
doi: 10.1038/nbt.2024.

Targeted RNA sequencing reveals the deep complexity of the human transcriptome

Affiliations

Targeted RNA sequencing reveals the deep complexity of the human transcriptome

Tim R Mercer et al. Nat Biotechnol. .

Abstract

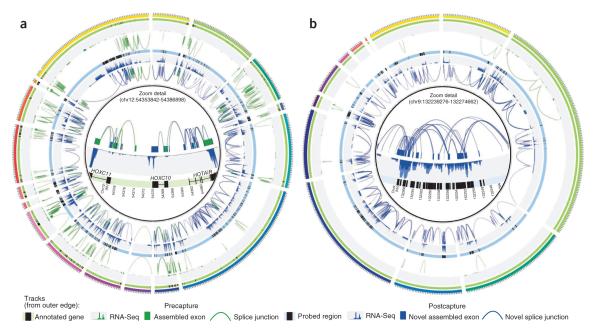
Transcriptomic analyses have revealed an unexpected complexity to the human transcriptome, whose breadth and depth exceeds current RNA sequencing capability. Using tiling arrays to target and sequence select portions of the transcriptome, we identify and characterize unannotated transcripts whose rare or transient expression is below the detection limits of conventional sequencing approaches. We use the unprecedented depth of coverage afforded by this technique to reach the deepest limits of the human transcriptome, exposing widespread, regulated and remarkably complex noncoding transcription in intergenic regions, as well as unannotated exons and splicing patterns in even intensively studied protein-coding loci such as p53 and HOX. The data also show that intermittent sequenced reads observed in conventional RNA sequencing data sets, previously dismissed as noise, are in fact indicative of unassembled rare transcripts. Collectively, these results reveal the range, depth and complexity of a human transcriptome that is far from fully characterized.


Figures

Figure 1
Figure 1
Circle plots illustrating the prevalence and complexity of captured transcripts at genic (a) and intergenic (b) loci. Successive tracks from outer edge indicate the following features: (i) genomic position (colored bars indicate different chromosomes and black ticks demarcate 5 kb); (ii) previous gene annotations (black bars on green background); (iii) frequency distribution of sequenced read alignments from precapture library (green histogram on gray background); (iv) assembled transcript structures from precapture library (green bars indicate exons and links indicate splice junctions); (v) probed regions represented on capture array (black bars on blue background); (vi) frequency distribution of sequenced read alignments from CaptureSeq library (blue histogram on gray background); and (vii) assembled transcript structures from CaptureSeq library (green bars and links correspond to exons and splice junctions identified in both pre- and CaptureSeq libraries, blue bars and links correspond to exons and splice junctions exclusively identified in CaptureSeq libraries). Inset shows detail of selected regions. Plot generated using Circos software (http://www.circos.ca/).
Figure 2
Figure 2
Resolution of unannotated p53 isoforms. (a) Genome-browser view of the p53 gene. The coverage and relative expression as determined by conventional RNA-Seq is indicated by upper red histogram. (b) Genome-browser view showing unannotated alternative splicing (blue; i–iv) identified using RNA CaptureSeq. The relative coverage and expression as determined by RNA CaptureSeq are also indicated by upper histogram (blue). (c) Relative expression of alternative unannotated p53 isoforms. The annotated (known, red) and unannotated (novel, blue) isoforms of p53, along with expected modifications to characterized protein domains are indicated in left panel. The relative expression of annotated and unannotated isoforms is indicated in right panel (error bars indicate upper and lower bound of 95% confidence interval).
Figure 3
Figure 3
Identification of unannotated exon variants and rare intergenic noncoding RNAs by targeted RNA capture and sequencing. (a) Genome-browser view of HOTAIR showing six unannotated isoforms (i), including fine-scale alternate splicing events (ii; zoom detail) that generate 16 additional unannotated isoforms. Relative abundance and coverage in RNA-Seq (upper blue histogram) and CaptureSeq (upper red histogram) libraries from foot fibroblast cell line indicated. (iii) Relative abundance of exon variants. (b) Differential expression across HOXA loci (black bars show gene annotations) between lung and foot fibroblasts, reflecting the different anatomical origin of each cell line. Coverage and relative abundance by RNA CaptureSeq (histograms) is indicated for each cell line. (c) Relative enrichment of HOXA genes and lncRNAs (1–7) between foot (F) and lung (L) fibroblasts as determined by CaptureSeq (dark gray) or qRT-PCR using precapture (light gray) or postcapture (medium gray) RNA samples. (d) Cumulative frequency distribution showing codon substitution frequency of full-length transcripts assembled from captured libraries (blue), coding genes (green) and known noncoding RNAs (red) for reference. (e) Cumulative frequency distribution indicates the normalized expression of full-length unannotated intergenic ncRNAs (red) relative to subset of genes captured on array (blue; captured) or genes identified by conventional RNA-Seq (green; all). (f) Cumulative frequency distribution showing the raw sequenced read frequency aligning to captured intergenic transcripts from both RNA-Seq (dashed red) and CaptureSeq (blue) and all assembled transcripts from RNA-Seq (solid red). The large difference in raw alignment frequency suggests saturated coverage achieved by CaptureSeq. (g) Pie chart indicating the proportion of RNA-Seq reads assigned to assembled transcripts, previous gene annotations, or unassignable reads occurring in intronic or intergenic regions. Bar indicates the proportion of unassigned intronic or intergenic reads ‘rescued’ by incorporation into rare transcript exons.

Comment in

References

    1. Birney E, et al. Identification and analysis of functional elements in 1% of the human genome by the ENCODE pilot project. Nature. 2007;447:799–816. - PMC - PubMed
    1. Carninci P, et al. The transcriptional landscape of the mammalian genome. Science. 2005;309:1559–1563. - PubMed
    1. Katayama S, et al. Antisense transcription in the mammalian transcriptome. Science. 2005;309:1564–1566. - PubMed
    1. van Bakel H, Nislow C, Blencowe BJ, Hughes TR. Response to “the reality of pervasive transcription”. PLoS Biol. 2011;9:e1001102. - PMC - PubMed
    1. Clark MB, et al. The reality of pervasive transcription. PLoS Biol. 2011;9:e1000625. - PMC - PubMed

Publication types

Associated data