Berkson's bias, selection bias, and missing data
- PMID: 22081062
- PMCID: PMC3237868
- DOI: 10.1097/EDE.0b013e31823b6296
Berkson's bias, selection bias, and missing data
Abstract
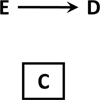
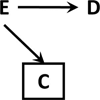
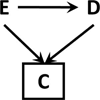
Although Berkson's bias is widely recognized in the epidemiologic literature, it remains underappreciated as a model of both selection bias and bias due to missing data. Simple causal diagrams and 2 × 2 tables illustrate how Berkson's bias connects to collider bias and selection bias more generally, and show the strong analogies between Berksonian selection bias and bias due to missing data. In some situations, considerations of whether data are missing at random or missing not at random are less important than the causal structure of the missing data process. Although dealing with missing data always relies on strong assumptions about unobserved variables, the intuitions built with simple examples can provide a better understanding of approaches to missing data in real-world situations.
Conflict of interest statement
CONFLICTS
No conflicts of interest.
Figures


References
-
- Berkson J. Limitations of the Application of Fourfold Table Analysis to Hospital Data. Biometrics Bulletin. 1946;2(3):47–53. - PubMed
-
- Greenland S. Quantifying biases in causal models: classical confounding vs collider-stratification bias. Epidemiology. 2003;14(3):300–306. - PubMed
-
- Hernán MA, Hernandez-Diaz S, Robins JM. A structural approach to selection bias. Epidemiology. 2004;15(5):615–625. - PubMed
-
- Rubin DB. Inference and Missing Data. Biometrika. 1976;63:581–592.
-
- Little RJA, Rubin DB. Statistical Analysis with Missing Data. New York: John Wiley; 1987.
Publication types
MeSH terms
Substances
Grants and funding
LinkOut - more resources
Full Text Sources

