. 2011 Nov 13;14(12):1599-605.
doi: 10.1038/nn.2973.

Flexible, foldable, actively multiplexed, high-density electrode array for mapping brain activity in vivo

Affiliations

Flexible, foldable, actively multiplexed, high-density electrode array for mapping brain activity in vivo

Jonathan Viventi et al. Nat Neurosci. .

Abstract

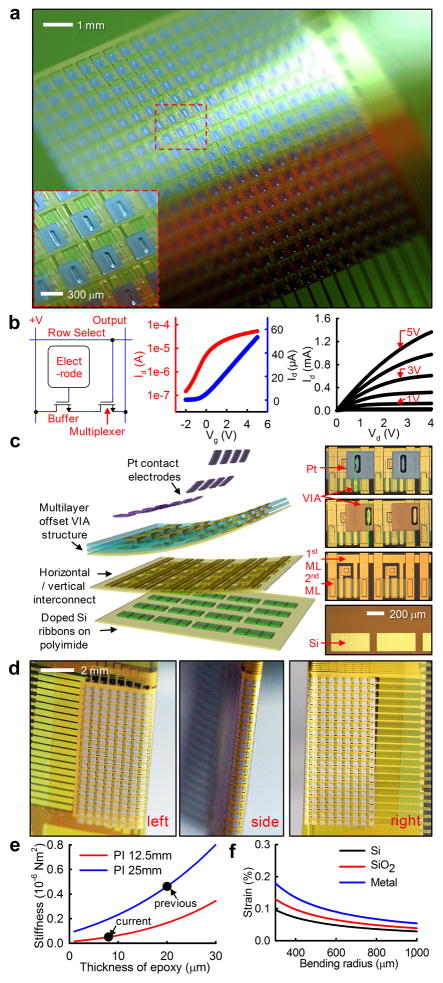
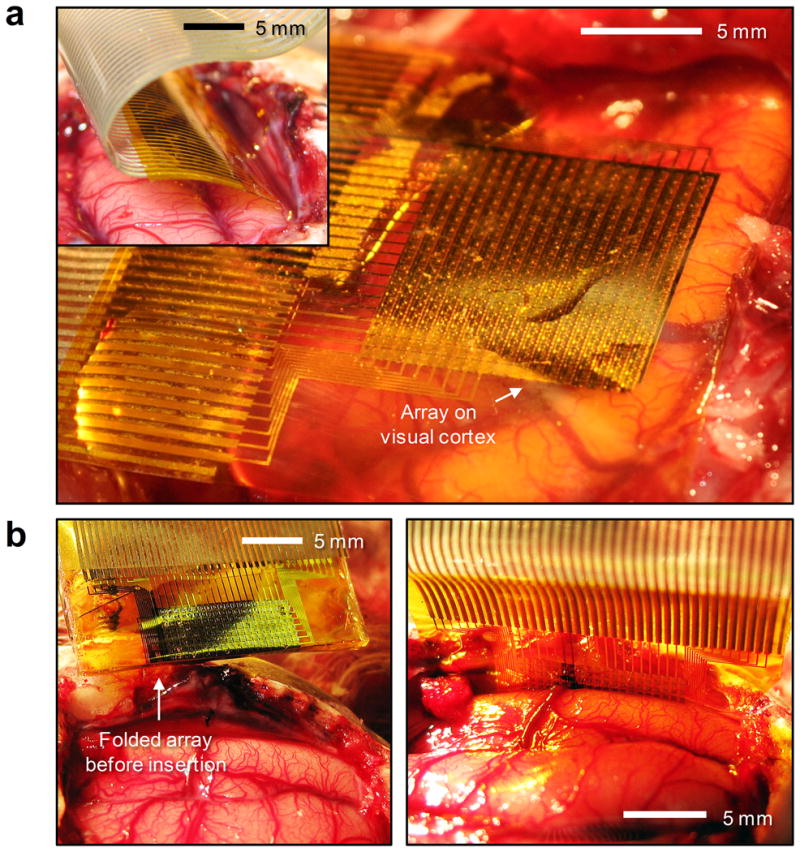
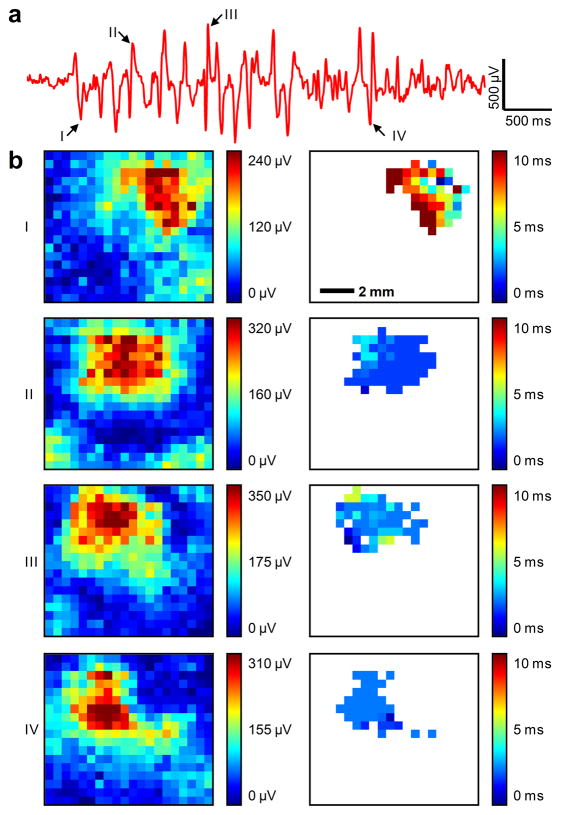
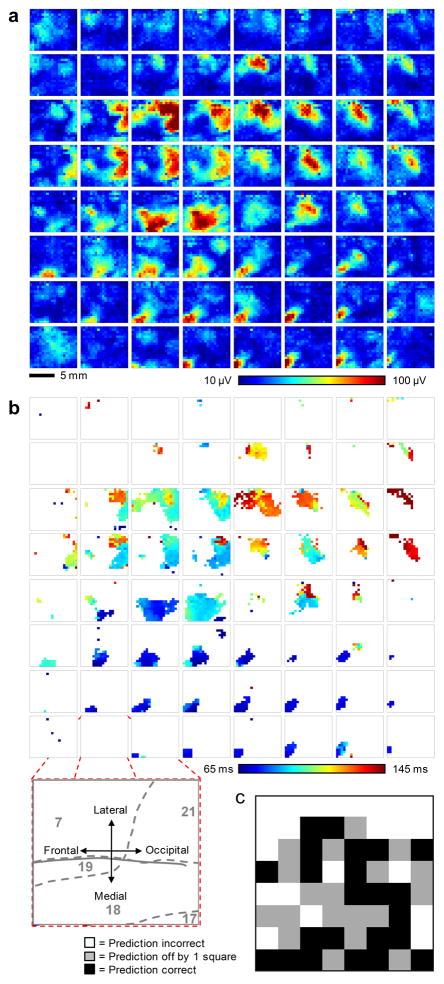
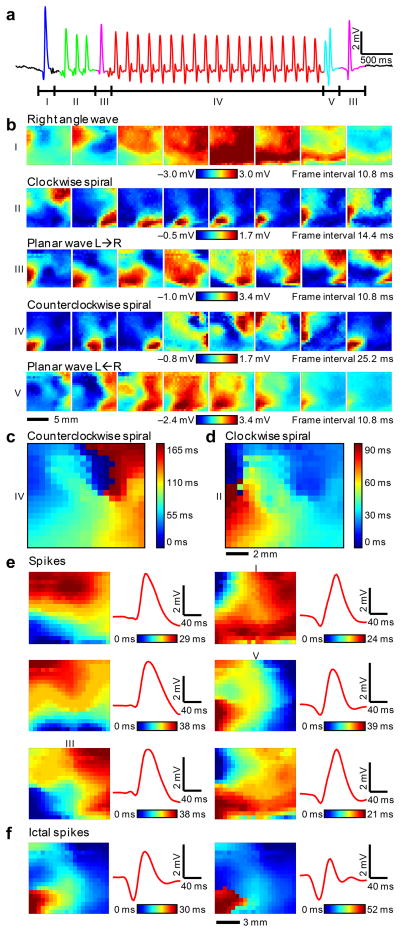
Arrays of electrodes for recording and stimulating the brain are used throughout clinical medicine and basic neuroscience research, yet are unable to sample large areas of the brain while maintaining high spatial resolution because of the need to individually wire each passive sensor at the electrode-tissue interface. To overcome this constraint, we developed new devices that integrate ultrathin and flexible silicon nanomembrane transistors into the electrode array, enabling new dense arrays of thousands of amplified and multiplexed sensors that are connected using fewer wires. We used this system to record spatial properties of cat brain activity in vivo, including sleep spindles, single-trial visual evoked responses and electrographic seizures. We found that seizures may manifest as recurrent spiral waves that propagate in the neocortex. The developments reported here herald a new generation of diagnostic and therapeutic brain-machine interface devices.


Conflict of interest statement

COMPETING FINANCIAL INTERESTS

The authors declare no competing financial interest.

Figures

Figure 1
Figure 1. Flexible, high-resolution multiplexed electrode array
a, Photograph of a 360 channel high density active electrode array. The electrode size and spacing was 300 μm × 300 μm and 500 μm, respectively. (inset) A closer view showing a few unit-cells. b, Schematic circuit diagram of single unit-cell containing two matched transistors (left), transfer characteristics of drain-to-source current (Ids) from a representative flexible transistor on linear (blue) and logarithmic (red) scales as gate to source voltage (Vgs) was swept from −2 to +5 V, demonstrating the threshold voltage (Vt) of the transistor (center). Current-voltage characteristics of a representative flexible silicon transistor (right). Ids was plotted as a function of drain-to-source voltage (Vds). Vgs was varied from 0 to 5 V in 1–V steps. c, Schematic exploded view (left) and corresponding microscope image of each layer: doped silicon nanoribbons (right frame, bottom), after vertical and horizontal interconnection with arrows indicating the 1st and 2nd metal layers (ML) (right frame, 2nd from bottom), after water-proof encapsulation (right frame, 3rd from bottom) and after platinum electrode deposition (right frame, top). Green dashed lines illustrated the offset via structure, critical to preventing leakage current while submerged in conductive fluid. d, Images of folded electrode array around low modulus Polydimethylsiloxane (PDMS) insert. e, bending stiffness of electrode array for varying epoxy thicknesses and two different PI substrate thicknesses. A nearly 10-fold increase in flexibility between the current device and our prior work was shown. f, Induced strain in different layers depending on the change in bending radius.
Figure 2
Figure 2. Animal experiment using feline model
a, A flexible, high-density, active electrode array placed on the visual cortex. (inset) The same electrode array inserted into the interhemispheric fissure. b, Folded electrode array before insertion into the interhemispheric fissue (left). Flat electrode array inserted into the interhemispheric fissure (right).
Figure 3
Figure 3. Spontaneous barbiturate-induced sleep spindles
a, A typical spindle recorded from a representative channel. Negative is plotted up by convention. Arrows point to individual spikes of the spindle (I – IV) further analyzed in the following panel. b, Root-mean-square (RMS) value of the zero-meaned signal of individual sharply contoured waves comprising the spindle demonstrated the high sensitivity of the electrode array and the spatially-localized nature of spindles (left column) as well as the high degree of temporal synchronization indicated by the relative time to peak across the array (right column). Data are anatomically orientated as shown in the inset of Figure 4b.
Figure 4
Figure 4. Visual evoked response analysis to a 2-dimensional sparse noise visual stimulus
a, 64 color maps, each showing the response (root-mean-square (RMS) value of the zero-meaned signal within the response window) of the entire 360 channel electrode array. The color maps are arranged in the same physical layout as the stimuli are presented on the monitor, i.e. the image map in the upper left hand corner of the figure represents the neural response across the entire array to a flashing box presented in the upper left hand corner of the monitor. The color scale is constant over all 64 image maps and is saturated at the 1st and 99th percentile respectively to improve the visual display. b, 64 color maps generated from the same response data as in a, but plotting the response latency in ms. Channels that did not show a strong response, as determined by exceeding 50% of the maximum evoked response, were excluded and are colored white. (inset) Exploded view illustrates the anatomical orientation of the electrode array on the brain and approximate location of Brodmann’s areas (grey numbers and dashed lines). c, Performance results achieved after subjecting a test set of data to a deep belief net classifier in accurately determining each originating location on the screen of respective stimuli. 23 of the 64 screen locations (36%) were predicted exactly correct (black boxes), significantly better than chance (1.6%). 42 of 64 (66%) screen locations were predicted correctly within one neighboring square (grey boxes, distance ≤ √2, chance level 11.8%).
Figure 5
Figure 5. Detailed 2-dimensional data from electrographic seizures in feline neocortex
a, μECoG signal from a representative channel of the electrode array during a short electrographic seizure. Negative is plotted up by convention. Labelled segments correspond to movie frames below. b, Movie frames show varied spatial-temporal μECoG voltage patterns from all 360 electrodes during the labelled time intervals from Figure 5a. The frame interval and color scale are provided for each set of 8 movie frames and the color scale is saturated at the 2nd and 98th percentile respectively over 8 frames to improve the visual display. Data are anatomically orientated as shown in the inset of Figure 4b. c, Relative delay map for the 4 to 8 Hz band-pass filtered data from 3 seconds of continuous clockwise spiral rotations (Fig. 5b, waveform IV) illustrating a clear phase singularity and counter clockwise rotation. d, Relative delay map for narrow band-pass filtered data from ~0.5 seconds of clockwise spiral rotations (Fig. 5b, waveform II) illustrating clockwise rotation, but a less clear singularity. e, Representative delay image maps from six different spike clusters are shown to illustrate the differences between clusters (left columns). The average waveform for the corresponding spike (red traces, right columns) illustrates that complicated spatial patterns at the micro scale (0.5 mm) can be indistinguishable at the current clinical scale (~10mm). Numerals I, III and V indicate the clusters that the corresponding waves in Fig. 5b belong to. f, Representative delay image maps from two clusters that occurred almost exclusively during seizures, illustrating striking differences in spatial-temporal micro scale patterns during seizures.

References

    1. Freeman W. Spatial spectral analysis of human electrocorticograms including the alpha and gamma bands. Journal of Neuroscience Methods. 2000;95:111–121. - PubMed
    1. Kellis SS, House PA, Thomson KE, Brown R, Greger B. Human neocortical electrical activity recorded on nonpenetrating microwire arrays: applicability for neuroprostheses. Neurosurgical focus. 2009;27:E9. - PMC - PubMed
    1. Kellis S, et al. Decoding spoken words using local field potentials recorded from the cortical surface. Journal of neural engineering. 2010;7:056007. - PMC - PubMed
    1. Kitzmiller JP, et al. Micro-field evoked potentials recorded from the porcine sub-dural cortical surface utilizing a microelectrode array. Journal of neuroscience methods. 2007;162:155–61. - PMC - PubMed
    1. Schevon CA, et al. Microphysiology of epileptiform activity in human neocortex. Journal of clinical neurophysiology: official publication of the American Electroencephalographic Society. 2008;25:321–30. - PMC - PubMed

Publication types