. 2011 Nov 13;14(12):1562-8.
doi: 10.1038/nn.2977.

Leptin regulates the reward value of nutrient

Affiliations

Leptin regulates the reward value of nutrient

Ana I Domingos et al. Nat Neurosci. .

Abstract

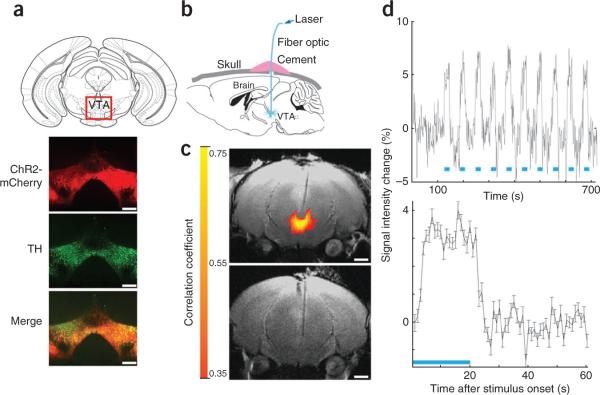
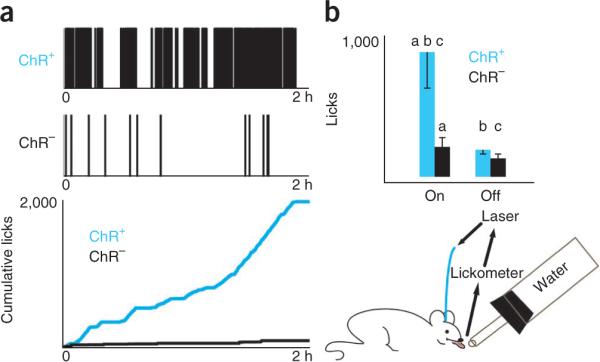
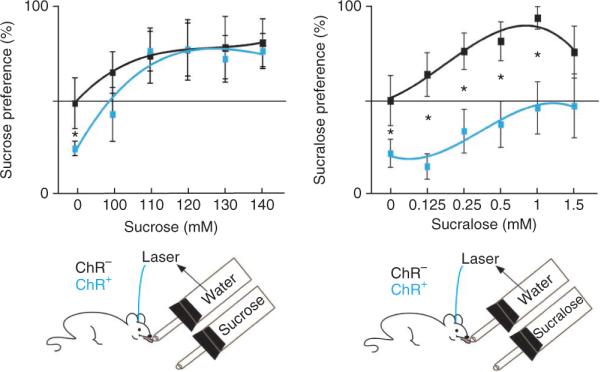
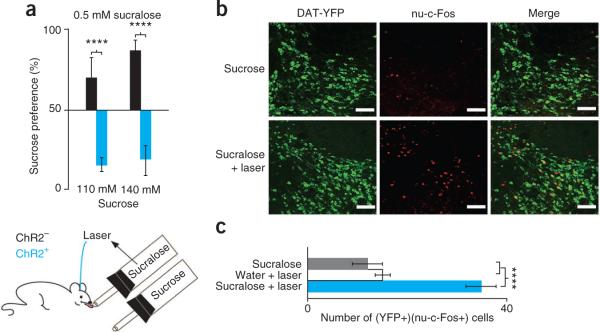
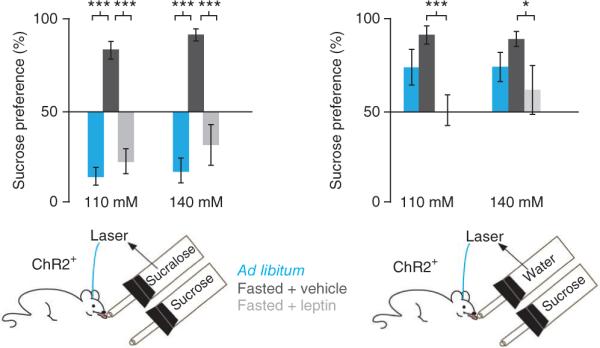
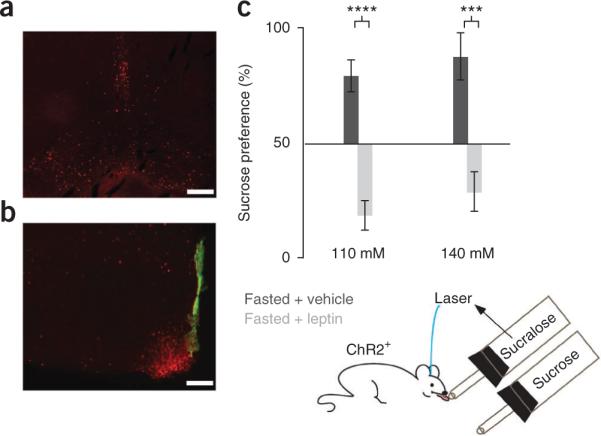
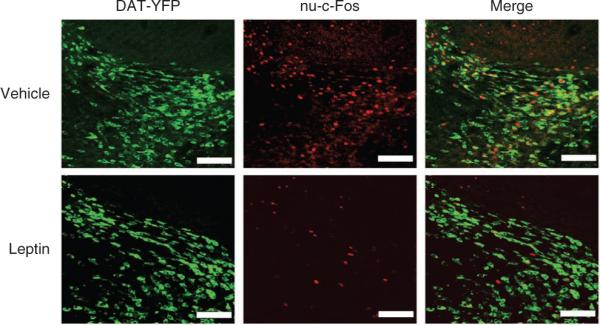
We developed an assay for quantifying the reward value of nutrient and used it to analyze the effects of metabolic state and leptin. In this assay, mice chose between two sippers, one of which dispensed water and was coupled to optogenetic activation of dopaminergic (DA) neurons and the other of which dispensed natural or artificial sweeteners. This assay measured the reward value of sweeteners relative to lick-induced optogenetic activation of DA neurons. Mice preferred optogenetic stimulation of DA neurons to sucralose, but not to sucrose. However, the mice preferred sucralose plus optogenetic stimulation versus sucrose. We found that food restriction increased the value of sucrose relative to sucralose plus optogenetic stimulation, and that leptin decreased it. Our data suggest that leptin suppresses the ability of sucrose to drive taste-independent DA neuronal activation and provide new insights into the mechanism of leptin's effects on food intake.


Figures

Figure 1
Figure 1
Optogenetic activation of DA neurons. (a) AAV-DIO–ChR2-mCherry injection into Dat-cre mice led to ChR2-mCherry expression in VTA neurons colocalizing with tyrosine hydroxylase (TH), a marker for DA neurons. Scale bars represent 1 μm. (b) Optical fibers implanted above the VTA for photoactivation of DA neurons. (c) ofMRI activation in ChR2-expressing (top) and control (bottom) mice, near the fiber tip. Red to yellow colors indicate correlation coefficients. Scale bars represent 1 mm. (d) The ofMRI signal was steady across sequential stimulus onsets (top, average across 14 repetitions) and across mice (bottom, n = 3), in all of the active voxels in the main cluster located near the end tip of the fiber. Error bars show error of the mean, in percentage of baseline signal activity (see Online Methods). Scale bars represent 1 mm.
Figure 2
Figure 2
The optogenetic licking assay drives voluntary ingestion in nondeprived mice. (a) Drinking behavior was monitored using a contact lickometer, which is connected to a laser switch. The switch was activated for 1 s after every five licks. Single-animal data obtained during a 2-h session are shown. Top, a lick raster plot for a ChR2-expressing mouse (ChR2+, 1,815 licks, top raster) and a control mouse (ChR, 101 licks, bottom raster). Bottom, cumulative lick count throughout a 2-h session for both mice. (b) In 1 h, nondeprived ChR2-expressing mice with the laser on (n = 22) licked the spout 904.2 ± 265 times versus 225.2 ± 58 times for control mice (ANOVA, P < 0.041; pairs of letters indicate significant pairs using Tukey-Kramer post hoc comparison). The effect was not observed in control mice (n = 14, 2 mice) assayed with the laser on or in control mice assayed with the laser off (n = 20) (P > 0.15, ANOVA Tukey-Kramer post hoc comparison).
Figure 3
Figure 3
Sucrose has higher value than sucralose. ChR2-expressing (n = 5) and control (n = 4) mice were given a choice between either water and laser or sucrose (or sucralose) for 10 min. At baseline (0 mM), ChR2-expressing mice (n = 21) showed a high preference for water and laser activation (70 ± 3%), as compared with control animals (50 ± 2%, n = 23). *P < 0.05. Left, sucrose was preferred at all concentrations to water and laser. ChR2-expressing and control mice had similar preference scores (all P > 0.13). Preference scores among ChR2-expressing mice were significantly different from baseline (P < 0.05 for 100 mM and P < 0.008 for 110–140 mM). Right, ChR2-expressing mice were given a choice between either sucralose or water and laser. Coupling laser to water significantly shifted an animal's preference away from sucralose, which was not observed in control animals (P < 0.002 for 0.125 mM, P < 0.0056 for 0.25 mM, P < 0.0095 for 0.5 mM, P < 0.0032 for 1 mM). Error bars represent s.e.m.
Figure 4
Figure 4
Optogenetic activation of DA neurons reverses the preference of sucrose over sucralose and elicits activation of DA neurons. (a) Control (n = 4) and ChR2-expressing (n = 5) mice were given a choice between either sucrose or sucralose and laser (bottom). Control mice preferred 110 mM and 140 mM sucrose to 0.5 mM sucralose and laser (sucrose, 72 ± 12%, n = 6; sucralose, 90 ± 3%, n = 5; black bars), but ChR2-expressing mice preferred the reverse, with sucrose preference ratios of 13 ± 12% for 110 mM and 16 ± 7% for 140 mM (n = 9, blue bars). (b) Colocalization of nuclear c-Fos (nu-c-Fos) and YFP in Dat-cre; Rosa26-YFP mice revealed that sucralose and laser (34.2 ± 3 DA neurons per 512 pixel) activated more DA neurons than sucrose (14 ± 2 DA neurons per 512 pixel) (n = 5). Scale bars represent 20 μm. (c) Sucralose and laser activated more DA neurons than either sucralose (14.8 ± 2 DA neurons per 512 pixel) or water and laser (11.8 ± 1 DA neurons per 512 pixel) (n = 5). ****P < 0.0005. Error bars represent s.e.m.
Figure 5
Figure 5
Fasting increases the value of sucrose, and leptin reverses this effect. ChR2-expressing mice (n = 6) were fasted for 24 h and treated with leptin (gray bars) or vehicle (black bars). Left, fasted animals, injected with vehicle, preferred 110 mM and 140 mM sucrose to sucralose and laser, with sucrose preferences of 85 ± 4% and 93 ± 3%, respectively. Fasted mice injected with leptin (2 mg per kg) displayed 22 ± 7% preference for 110 mM sucrose and 31 ± 11% preference for 140 mM sucrose. Preference for 0.5 mM sucralose and laser in the ab libitum and leptin-treated groups were not significantly different (P > 0.35 for 110 mM and P > 0.22 for 140 mM) (blue bars, as in Fig. 4). Right, vehicle-treated fasted mice preferred 110 mM and 140 mM sucrose to water and laser (85 ± 6% and 83 ± 3%, respectively). Leptin-treated fasted mice had reduced preference for sucrose (110 mM, 51 ± 7%; 140 mM, 60 ± 8%). ***P < 0.0035, *P < 0.018. Error bars represent s.e.m.
Figure 6
Figure 6
Leptin corrects the fasting-induced increase in the value of sucrose via the CNS. (a,b) Acute intracerebroventricular injection of 100 ng of leptin leads to Stat3 phosphorylation in the VTA (a) and hypothalamus (b). Fluorospheres (green) labeled the third ventricle. Scale bars represent 100 μm. (c) We assayed mice (n = 6) for their preference for sucrose 1 h after leptin (light gray bars, right) or vehicle injection (dark gray bars, right). Vehicle-treated fasted mice preferred sucrose (110 mM, 77 ± 6%; 140 mM, 85 ± 9%), but leptin-treated fasted mice do not (110 mM, 22 ± 6%; 140 mM, 31 ± 8%). ****P < 0.0001, ***P < 0.0035. Error bars represent s.e.m.
Figure 7
Figure 7
Leptin supresses post-ingestive sucrose-induced DA neuron activation. Fasted Dat-cre; Rosa26-YFP mice were gavaged with 0.5 ml of 30% sucrose 1 h after an intraperitoneal injection of leptin or vehicle, and analyzed after 20 min. Colocalization of nuclear c-Fos and YFP revealed that leptin reduced DA neuron activation in response to sucrose. Scale bars represent 20 μm.

References

    1. Cameron JD, et al. The effects of prolonged caloric restriction leading to weight-loss on food hedonics and reinforcement. Physiol. Behav. 2008;94:474–480. - PubMed
    1. Epstein LH, et al. Effects of deprivation on hedonics and reinforcing value of food. Physiol. Behav. 2003;78:221–227. - PubMed
    1. Ren X, et al. Nutrient selection in the absence of taste receptor signaling. J. Neurosci. 2010;30:8012–8023. - PMC - PubMed
    1. Rozin P. Acquisition of food preferences and attitudes to food. Int. J. Obes. 1980;4:356–363. - PubMed
    1. Umabiki M, et al. The improvement of sweet taste sensitivity with decrease in serum leptin levels during weight loss in obese females. Tohoku J. Exp. Med. 2010;220:267–271. - PubMed

Publication types

MeSH terms