. 2011 Nov 13;43(12):1275-80.
doi: 10.1038/ng.997.

Parallel bacterial evolution within multiple patients identifies candidate pathogenicity genes

Affiliations

Parallel bacterial evolution within multiple patients identifies candidate pathogenicity genes

Tami D Lieberman et al. Nat Genet. .

Abstract

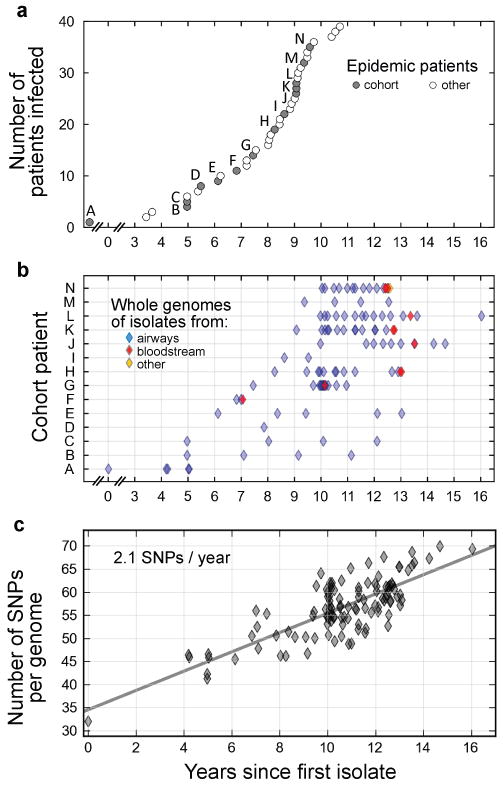
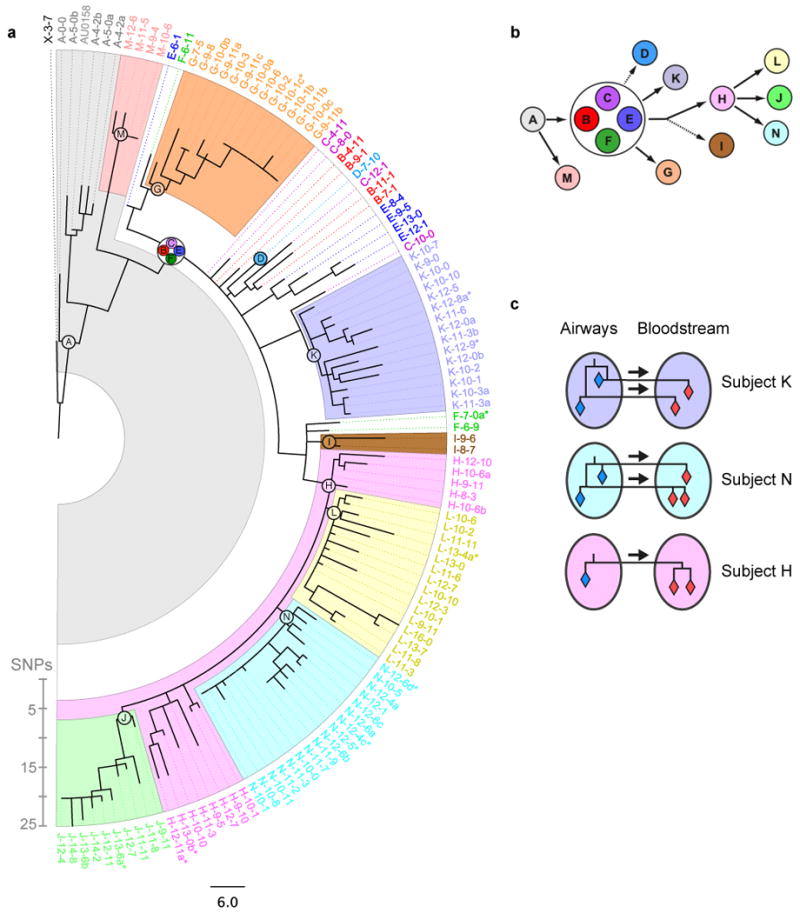
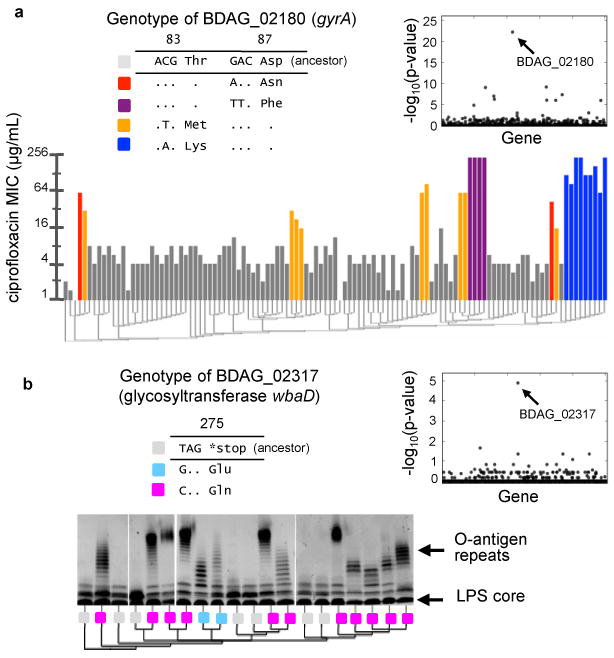
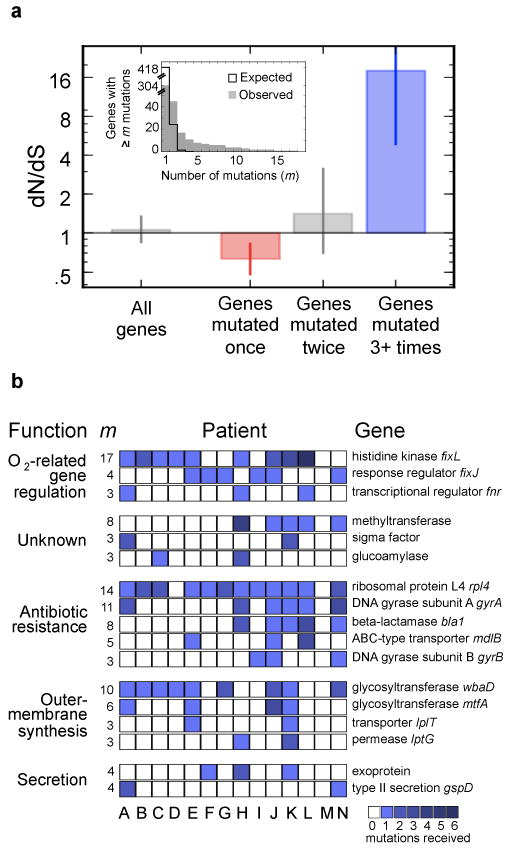
Bacterial pathogens evolve during the infection of their human host(1-8), but separating adaptive and neutral mutations remains challenging(9-11). Here we identify bacterial genes under adaptive evolution by tracking recurrent patterns of mutations in the same pathogenic strain during the infection of multiple individuals. We conducted a retrospective study of a Burkholderia dolosa outbreak among subjects with cystic fibrosis, sequencing the genomes of 112 isolates collected from 14 individuals over 16 years. We find that 17 bacterial genes acquired nonsynonymous mutations in multiple individuals, which indicates parallel adaptive evolution. Mutations in these genes affect important pathogenic phenotypes, including antibiotic resistance and bacterial membrane composition and implicate oxygen-dependent regulation as paramount in lung infections. Several genes have not previously been implicated in pathogenesis and may represent new therapeutic targets. The identification of parallel molecular evolution as a pathogen spreads among multiple individuals points to the key selection forces it experiences within human hosts.


Figures

Figure 1
Figure 1. Whole-genome sequencing of 112 Burkholderia dolosa isolates recovered from 14 epidemic patients indicates steady accumulation of mutations over years
a, An epidemic of B. dolosa spread to 39 people with cystic fibrosis over decades (circles). Time of first attested infection for each patient is indicated in years since the collection of an isolate from patient zero (labeled ‘A’). We studied retrospectively a cohort of 14 patients from this epidemic (gray circles, and labels). b, The genomes of 112 bacterial isolates were sequenced (diamonds; each horizontal line corresponds to a patient). Isolates were recovered over time from the patients' airways (blue), bloodstream (red) or other body compartments (for instance tissue obtained during surgery; orange). c, The number of SNPs between each isolate and the outgroup is plotted as a function of time (years since first isolate). Linear fit is plotted (slope = 2.1 mutations fixed per year).
Figure 2
Figure 2. Bacterial phylogeny reveals a likely network of transmission between patients, and between organs
a, The maximum-likelihood phylogenetic tree is displayed (SNP scale shown). The 112 isolates are indicated by thin dashed lines colored according to patient, and labeled according to patient and time (e.g., ‘C-14-5’ was recovered from patient C, fourteen years and five months after the first isolate). Blood isolates are indicated by a dollar sign, and isolates with the same patient and date are distinguished by letters. The last common ancestor (LCA) of isolates from the same patient is represented as a circle of the appropriate color and label. Colored backgrounds indicate patient-specific genetic fingerprints. Patients B, C, E, and F share the same LCA (white background). b, Phylogeny between the inferred LCAs suggests a likely network of infection between patients (arrows). Dashed arrows indicate less certainty (fewer than 3 isolates). c, Phylogeny between blood and lung isolates recovered from the same patient evidences the transmission of multiple clones to the bloodstream during bacteremia (multiple arrows, patients K and N).
Figure 3
Figure 3. Pathogenic phenotypes are associated with point mutations in key genes
a, Minimal inhibitory concentration (MIC) of ciprofloxacin for each isolate (vertical bars) is correlated with genotypic changes in BDAG_02180, a homolog to E. coli gyrA, which result in coding changes at residues 83 and 87. Phylogeny is indicated below as a dendrogram and genotypes at BDAG_02180 are shown in the legend. Inset: P values for correlation between the presence of mutations in each gene and resistance levels (Kendall's tau). b, Silver-stained gels showing the presence of O-antigen repeats (banded pattern) in the LPS of twenty isolates. Genotypes of BDAG_02317, a hoolog of glycosyltransferase wbaD, are shown in the legend. The presentation of O-antigen repeats corresponds to a recurrent gain-of-function mutation. Inset: P values for correlation between the presence of mutations in each gene and O-antigen presentation (Fischer's exact test).
Figure 4
Figure 4
Parallel evolution identifies a set of genes under strong selection during pathogenesis. a, Inset, The number of genes that acquired at least m mutations across the epidemic is plotted as a function of m (gray bars). This distribution contrasts sharply with the distribution expected for neutral evolution (black line). Under neutral evolution, the expectation is that only one gene would receive three or more mutations (m>3); instead, we observed 17 such genes. Main, The canonical signal for selection (dN/dS) is calculated for these 17 genes (109 mutations in these 17 genes), the 28 genes with m=2, and the 247 genes with m=1 (Supplementary Fig. 3 presents the contribution of these mutations to the molecular clock). Values of dN/dS greater than 1 indicate positive selection (blue), values smaller than 1 indicate purifying selection (red). Error bars indicate 95% CIs. Calculated over all genes without regard to m, this analysis would not show a signal for selection. b, Each one of the 17 genes (rows) under positive selection contained an acquired mutated in several patients, signified by squares (color intensity indicate the number of mutations observed within this patient). The total number of mutations observed within that gene, m, is indicated left. Genes are grouped by biological function, and labeled with the annotations of close homologs, and, when available, close homolog names.

Comment in

Similar articles

Cited by

References

    1. Suerbaum S, Josenhans C. Helicobacter pylori evolution and phenotypic diversification in a changing host. Nat Rev Microbiol. 2007;5:441–452. - PubMed
    1. Smith EE, et al. Genetic adaptation by Pseudomonas aeruginosa to the airways of cystic fibrosis patients. Proc Natl Acad Sci U S A. 2006;103:8487–8492. - PMC - PubMed
    1. Musher DM, et al. Emergence of macrolide resistance during treatment of pneumococcal pneumonia. N Engl J Med. 2002;346:630–631. - PubMed
    1. Wong A, Kassen R. Parallel evolution and local differentiation in quinolone resistance in Pseudomonas aeruginosa. Microbiology. 2011;157:937–944. - PubMed
    1. Zdziarski J, et al. Host imprints on bacterial genomes—rapid divergent evolution in individual patients. PLoS Path. 2010;6:e1001078. - PMC - PubMed

Publication types

MeSH terms