

Effect of infertility treatment and pregnancy-related hormones on breast cell proliferation in vitro
- PMID: 22081245
- PMCID: PMC3241605
- DOI: 10.1093/humrep/der378
Effect of infertility treatment and pregnancy-related hormones on breast cell proliferation in vitro
Abstract
Background: Breast cancer development involves a series of mutations in a heterogeneous group of proto-oncogenes/tumor suppressor genes that alter mammary cells to create a microenvironment permissive to tumorigenesis. Exposure to hormones during infertility treatment may have a mutagenic effect on normal mammary epithelial cells, high-risk breast lesions and early-stage breast cancers. Our goal was to understand the association between infertility treatment and normal and cancerous breast cell proliferation.
Methods: MCF-10A normal mammary cells and the breast cancer cell lines MCF-7 [estrogen receptor (ER)-positive, well differentiated] and HCC 1937 (ER-negative, aggressive, BRCA1 mutation) were treated with the weak ER activator clomiphene citrate and hormones that are increased during infertility treatment. Direct effects of treatment on cell proliferation and colony growth were determined.
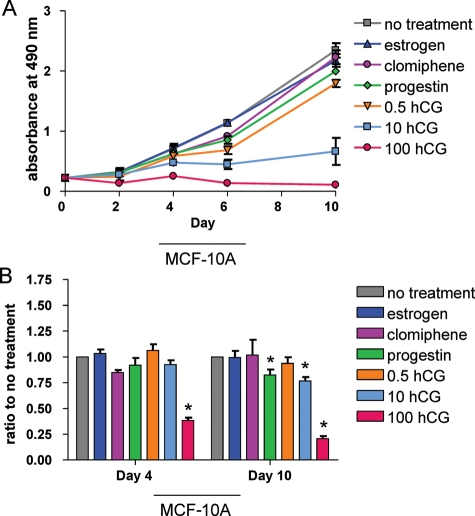
Results: While clomiphene citrate had no effect on MCF-10A cells or MCF-7 breast cancer cells, it decreased proliferation of HCC 1937 versus untreated cells (P= 0.003). Estrogen had no effect on either MCF-10A or HCC 1937 cells but, as expected, increased cell proliferation (20-100 nM; P≤0.002) and colony growth (10-30 nM; P< 0.0001) of MCF-7 cells versus control. Conversely, progesterone decreased both proliferation (P= 0.001) and colony growth (P= 0.01) of MCF-10A cells, inhibited colony size of MCF-7 cells (P= 0.01) and decreased proliferation of HCC 1937 cells (P= 0.008) versus control. hCG (100 mIU/ml) decreased both proliferation (P ≤ 0.01) and colony growth (P ≤ 0.002) of all three cell lines.
Conclusions: Although these data are preclinical, they support possible indirect estrogenic effects of infertility regimens on ER-positive breast cancer cells and validate the potential protective effect of pregnancy-related exposure to hCG.
Figures


Similar articles
-
Impact of infertility regimens on breast cancer cells: follicle-stimulating hormone and luteinizing hormone lack a direct effect on breast cell proliferation in vitro.Fertil Steril. 2012 Feb;97(2):440-4. doi: 10.1016/j.fertnstert.2011.11.020. Epub 2011 Dec 19. Fertil Steril. 2012. PMID: 22188984 Free PMC article.
-
Inhibition of MCF-7 breast cancer cell proliferation by MCF-10A breast epithelial cells in coculture.Cell Biol Int. 2006 Mar;30(3):227-38. doi: 10.1016/j.cellbi.2005.11.006. Epub 2006 Jan 19. Cell Biol Int. 2006. PMID: 16427788
-
Modeling breast acini in tissue culture for detection of malignant phenotype reversion to non-malignant phenotype.Iran Biomed J. 2009 Oct;13(4):191-8. Iran Biomed J. 2009. PMID: 19946344
-
Benign mammary epithelial cells enhance the transformed phenotype of human breast cancer cells.BMC Cancer. 2010 Jul 16;10:373. doi: 10.1186/1471-2407-10-373. BMC Cancer. 2010. PMID: 20637104 Free PMC article.
-
Primary prevention of breast cancer by hormone-induced differentiation.Recent Results Cancer Res. 2007;174:111-30. doi: 10.1007/978-3-540-37696-5_11. Recent Results Cancer Res. 2007. PMID: 17302191 Review.
Cited by
-
Human Breast Cancer Cell Lines Differentially Modulate Signaling from Distant Microenvironments, Which Reflects Their Metastatic Potential.Cancers (Basel). 2024 Feb 15;16(4):796. doi: 10.3390/cancers16040796. Cancers (Basel). 2024. PMID: 38398186 Free PMC article.
-
Fertility preservation in breast cancer patients.Breast Cancer. 2014 Nov;21(6):651-5. doi: 10.1007/s12282-013-0463-5. Epub 2013 Mar 24. Breast Cancer. 2014. PMID: 23526260 Free PMC article.
-
Progesterone receptor membrane component 1 promotes survival of human breast cancer cells and the growth of xenograft tumors.Cancer Biol Ther. 2016;17(3):262-71. doi: 10.1080/15384047.2016.1139240. Epub 2016 Jan 19. Cancer Biol Ther. 2016. PMID: 26785864 Free PMC article.
-
Dynamic changes in serum steroid hormone during the first trimester of pregnancy between infertile women conceiving with and without hormone replacement therapy.Heliyon. 2021 Sep 29;7(10):e08100. doi: 10.1016/j.heliyon.2021.e08100. eCollection 2021 Oct. Heliyon. 2021. PMID: 34660922 Free PMC article.
-
Progesterone action in endometrial cancer, endometriosis, uterine fibroids, and breast cancer.Endocr Rev. 2013 Feb;34(1):130-62. doi: 10.1210/er.2012-1043. Epub 2013 Jan 9. Endocr Rev. 2013. PMID: 23303565 Free PMC article. Review.
References
-
- ASRM B. Alabama. Age Fertil. 2003:1–20.
-
- Azim AA, Costantini-Ferrando M, Lostritto K, Oktay K. Relative potencies of anastrozole and letrozole to suppress estradiol in breast cancer patients undergoing ovarian stimulation before in vitro fertilization. J Clin Endocrinol Metab. 2007;92:2197–2200. - PubMed
-
- Azim AA, Costantini-Ferrando M, Oktay K. Safety of fertility preservation by ovarian stimulation with letrozole and gonadotropins in patients with breast cancer: a prospective controlled study. J Clin Oncol. 2008;26:2630–2635. - PubMed
-
- Baumann RJ, Bush TL, Cross-Doersen DE, Cashman EA, Wright PS, Zwolshen JH, Davis GF, Matthews DP, Bender DM, Bitonti AJ. Clomiphene analogs with activity in vitro and in vivo against human breast cancer cells. Biochem Pharmacol. 1998;55:841–851. - PubMed
-
- Blakely LJ, Buzdar AU, Lozada JA, Shullaih SA, Hoy E, Smith TL, Hortobagyi GN. Effects of pregnancy after treatment for breast carcinoma on survival and risk of recurrence. Cancer. 2004;100:465–469. - PubMed
Publication types
MeSH terms
Substances
Grants and funding
LinkOut - more resources
Full Text Sources
Medical
Miscellaneous
