

Metagenomic analysis of stress genes in microbial mat communities from Antarctica and the High Arctic
- PMID: 22081564
- PMCID: PMC3255749
- DOI: 10.1128/AEM.06354-11
Metagenomic analysis of stress genes in microbial mat communities from Antarctica and the High Arctic
Abstract
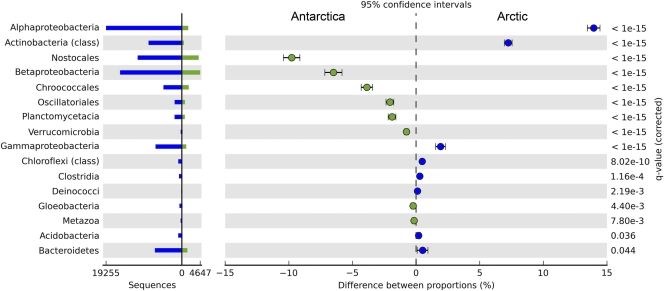
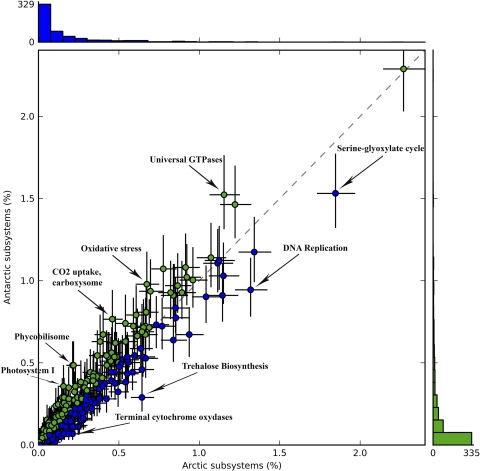
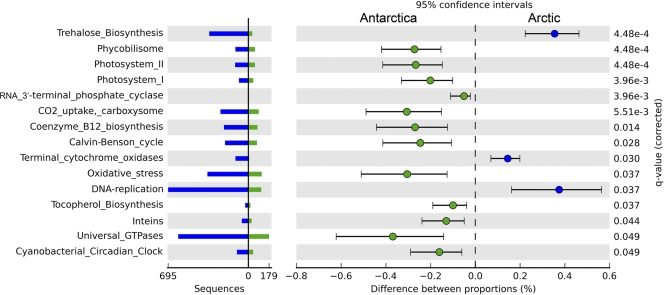
Polar and alpine microbial communities experience a variety of environmental stresses, including perennial cold and freezing; however, knowledge of genomic responses to such conditions is still rudimentary. We analyzed the metagenomes of cyanobacterial mats from Arctic and Antarctic ice shelves, using high-throughput pyrosequencing to test the hypotheses that consortia from these extreme polar habitats were similar in terms of major phyla and subphyla and consequently in their potential responses to environmental stresses. Statistical comparisons of the protein-coding genes showed similarities between the mats from the two poles, with the majority of genes derived from Proteobacteria and Cyanobacteria; however, the relative proportions differed, with cyanobacterial genes more prevalent in the Antarctic mat metagenome. Other differences included a higher representation of Actinobacteria and Alphaproteobacteria in the Arctic metagenomes, which may reflect the greater access to diasporas from both adjacent ice-free lands and the open ocean. Genes coding for functional responses to environmental stress (exopolysaccharides, cold shock proteins, and membrane modifications) were found in all of the metagenomes. However, in keeping with the greater exposure of the Arctic to long-range pollutants, sequences assigned to copper homeostasis genes were statistically (30%) more abundant in the Arctic samples. In contrast, more reads matching the sigma B genes were identified in the Antarctic mat, likely reflecting the more severe osmotic stress during freeze-up of the Antarctic ponds. This study underscores the presence of diverse mechanisms of adaptation to cold and other stresses in polar mats, consistent with the proportional representation of major bacterial groups.
Figures
References
-
- Allewalt JP, Bateson MM, Revsbech NP, Slack K, Ward DM. 2006. Effect of temperature and light on growth of and photosynthesis by Synechococcus isolates typical of those predominating in the Octopus Spring microbial mat community of Yellowstone National Park. Appl. Environ. Microbiol. 72:544–550 - PMC - PubMed
-
- Altschul SF, Gish W, Miller W, Myers EW, Lipman DJ. 1990. Basic local alignment search tool. J. Mol. Biol. 215:403–410 - PubMed
-
- Bottos EM, Vincent WF, Greer CW, Whyte LG. 2008. Prokaryotic diversity of arctic ice shelf microbial mats. Environ. Microbiol. 10:950–966 - PubMed
-
- Braissant O, et al. 2007. Exopolymeric substances of sulfate-reducing bacteria: interactions with calcium at alkaline pH and implication for formation of carbonate minerals. Geobiology 5:401–411
Publication types
MeSH terms
Grants and funding
LinkOut - more resources
Full Text Sources
Molecular Biology Databases
