

A measure for describing and comparing post-reproductive lifespan as a population trait
- PMID: 22081792
- PMCID: PMC3212949
- DOI: 10.1111/j.2041-210X.2011.00095.x
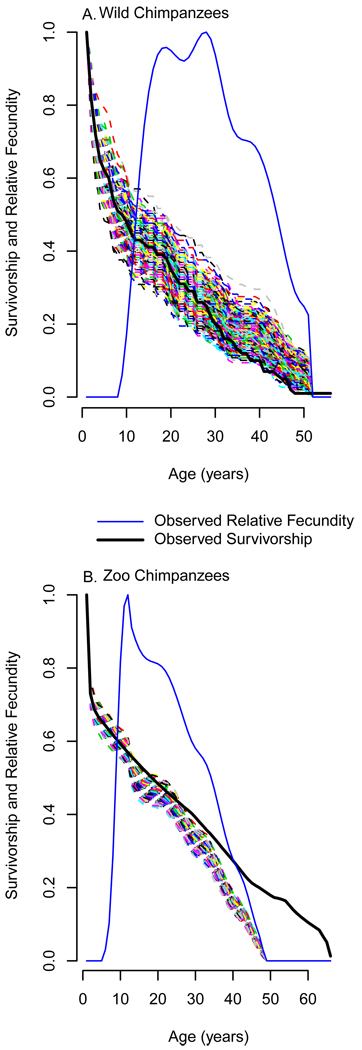
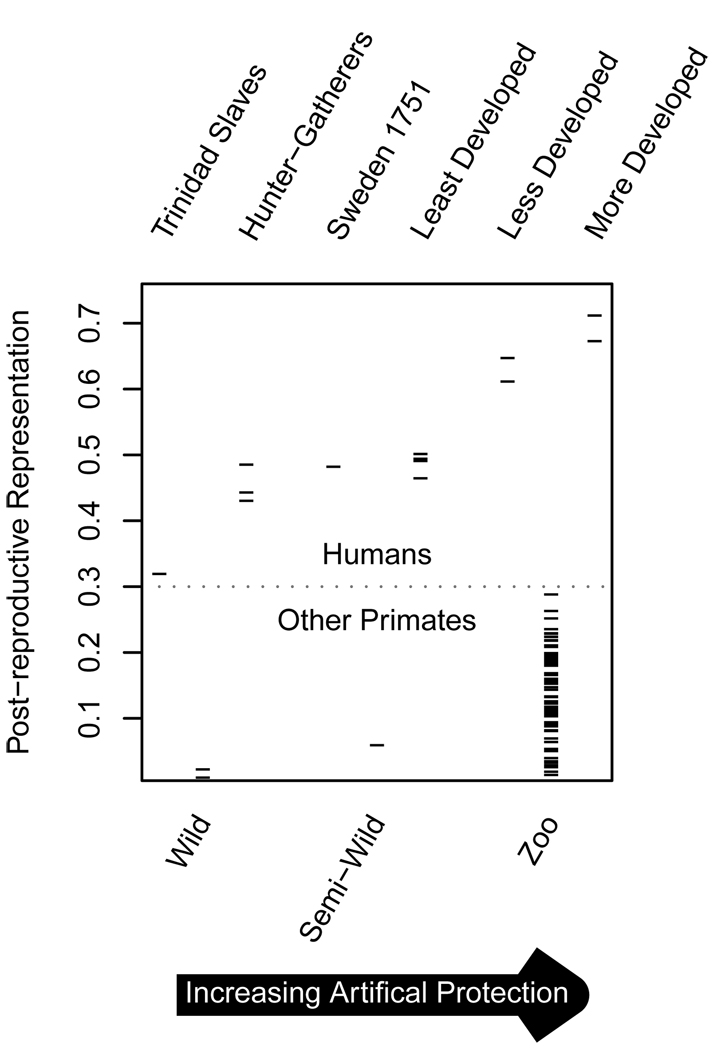
A measure for describing and comparing post-reproductive lifespan as a population trait
Abstract
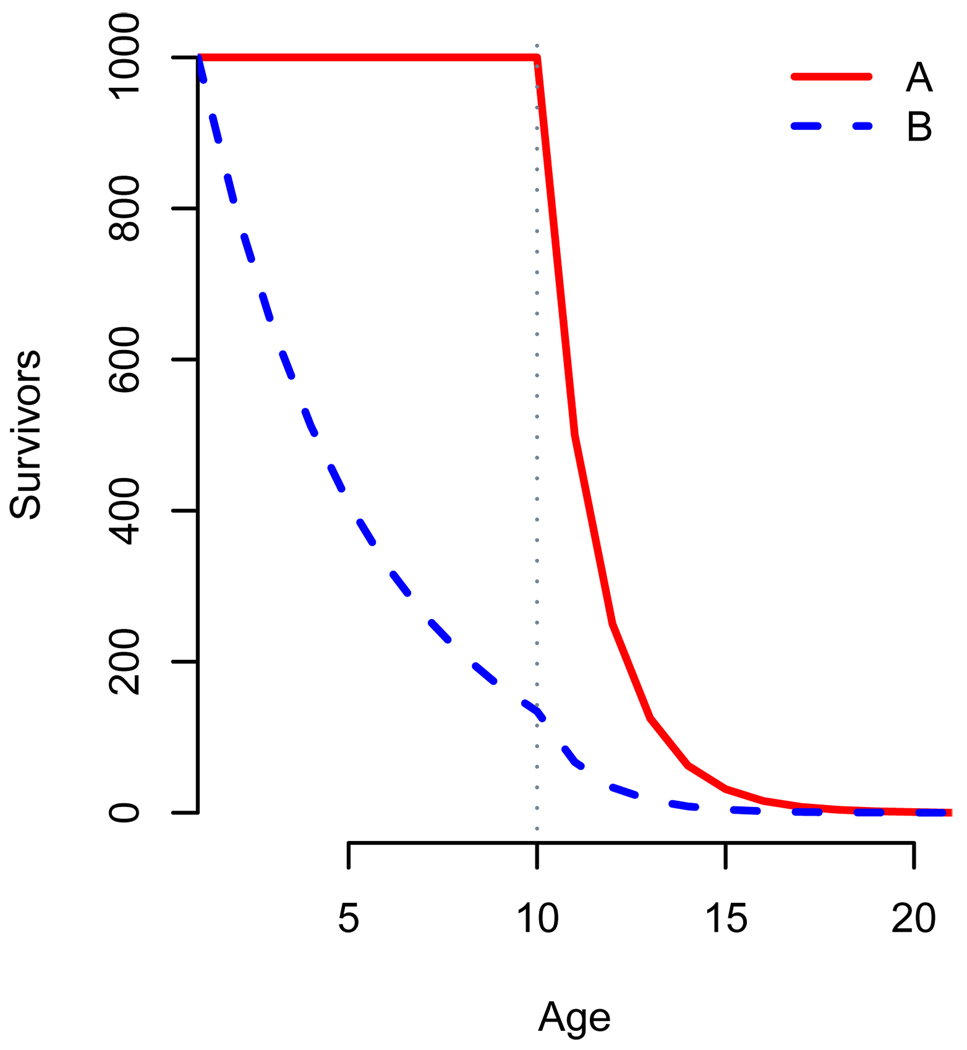
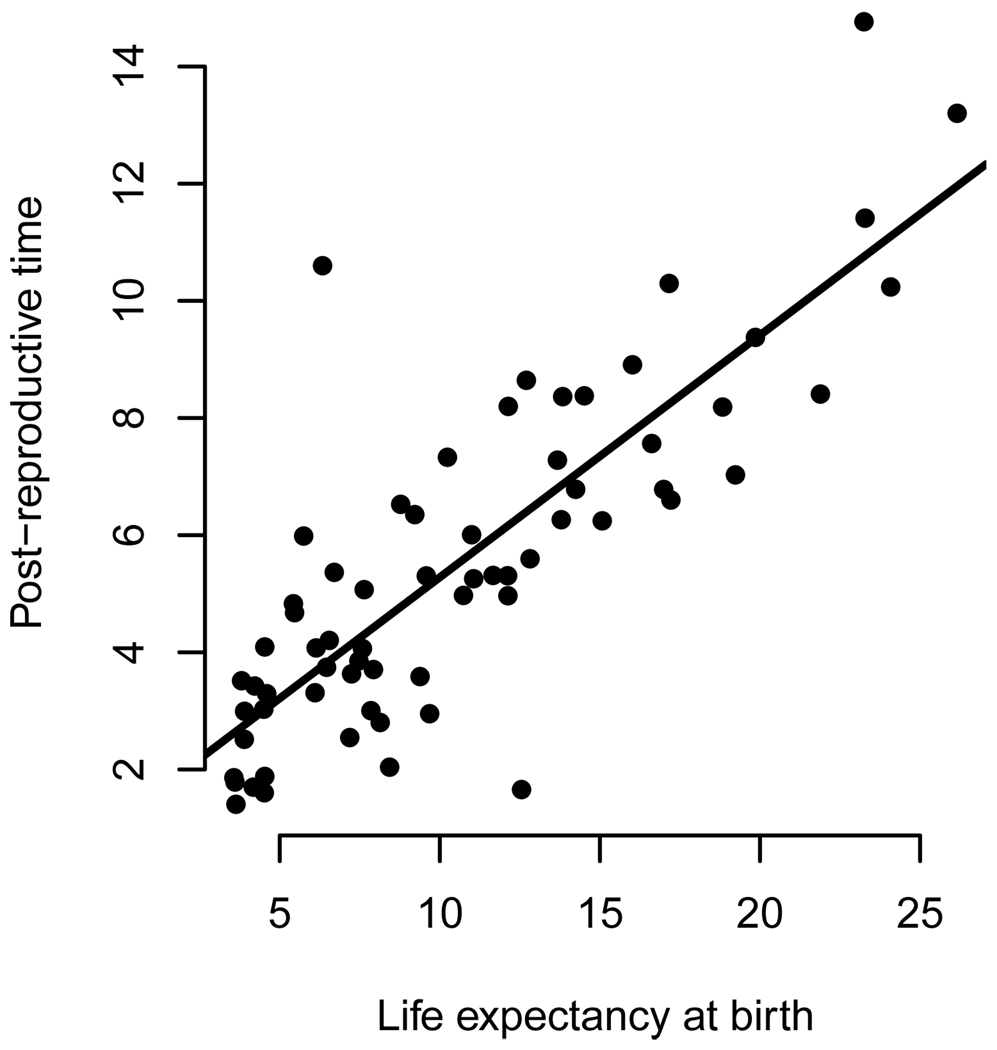
1. While-classical life-history theory does not predict post-reproductive lifespan (PRLS), it has been detected in a great number of taxa, leading to the view that it is a broadly conserved trait, and attempts to reconcile theory with these observations. We suggest an alternative: the apparently wide distribution of significant PRLS is an artifact of insufficient methods.2. PRLS is traditionally measured in units of time between each individual's last parturition and death, after excluding those individuals for whom this interval is short. A mean of this measure is then calculated as a population value. We show this traditional population measure (which we denote PrT) to be inconsistently calculated, inherently biased, strongly correlated with overall longevity, uninformative on the importance of PRLS in a population's life-history, unable to use the most-commonly available form of relevant data and without a realistic null hypothesis. Using data altered to ensure that the null hypothesis is true, we find a false positive rate of 0.47 for PrT.3. We propose an alternative population measure, using life-table methods. Post-reproductive Representation (PrR) is the proportion of adult years lived which are post-reproductive. We briefly derive PrR and discuss its properties. We employ a demographic simulation, based on the null hypothesis of simultaneous and proportional decline in survivorship and fecundity, to produce a null distribution for PrR based on the age-specific rates of a population.4. In an example analysis, using data on 84 populations of human and non-human primates, we demonstrate the ability of PrR to represent the effects of artificial protection from mortality and of humanness on PRLS. PrR is found to be higher for all human populations under a wide range of conditions than for any non-human primate in our sample. A strong effect of artificial protection is found, but humans under the most-adverse conditions still achieve PrR of >0.3.5. PrT should not be used as a population measure, and should be used as an individual measure only with great caution. The use of PrR as an intuitive, statistically valid and intercomparable population life-history measure is encouraged.
Figures
References
-
- Biodemographic Database. Max Planck Institute for Demographic Research. 2010.
-
- Alvarez HP. Grandmother hypothesis and primate life histories. American Journal of Physical Anthropology. 2000;113:435–450. - PubMed
-
- Austad SN. Postreproductive Survival. In: Wachter WK, Finch CE, editors. Between Zeus and the Salmon: The biodemography of longevity. Washington, D.C.: National Academy Press; 1997. pp. 161–174. - PubMed
-
- Blurton-Jones NG, Hawkes K, O Connell JF. Antiquity of postreproductive life: Are there modern impacts on hunter-gatherer postreproductive life spans? American Journal of Human Biology. 2002;14:184–205. - PubMed
-
- Bongaarts J. The proximate determinants of natural marital fertility. In: Bulatao AR, Lee RD, editors. Determinants of Fertility in Developing Countries. New York, NY: Population Council; 1982.
Grants and funding
LinkOut - more resources
Full Text Sources