. 2011 Nov 14;12(11):R113.
doi: 10.1186/gb-2011-12-11-r113.

Discovery of active enhancers through bidirectional expression of short transcripts

Affiliations

Discovery of active enhancers through bidirectional expression of short transcripts

Michael F Melgar et al. Genome Biol. .

Abstract

Background: Long-range regulatory elements, such as enhancers, exert substantial control over tissue-specific gene expression patterns. Genome-wide discovery of functional enhancers in different cell types is important for our understanding of genome function as well as human disease etiology.

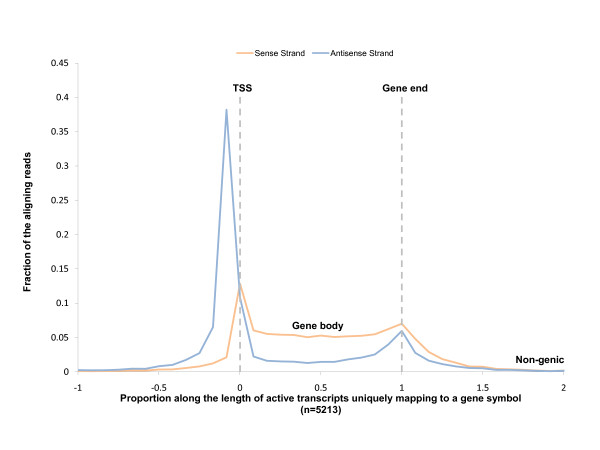
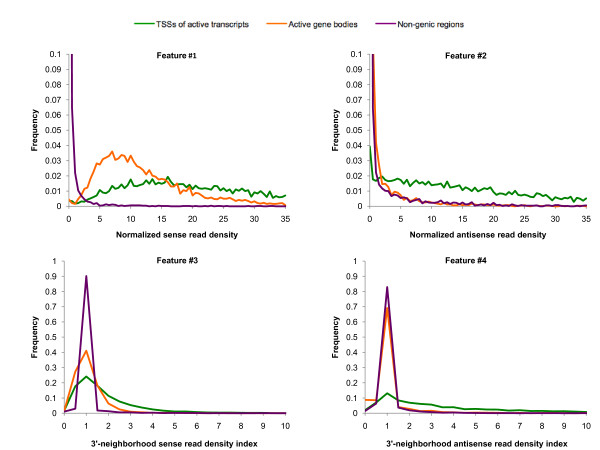
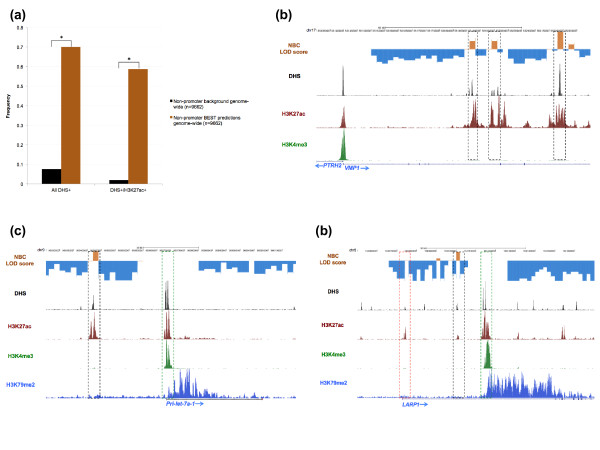
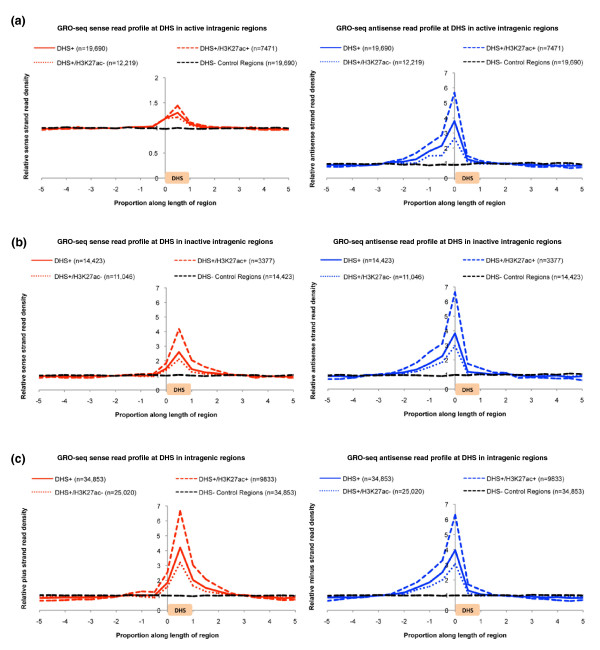
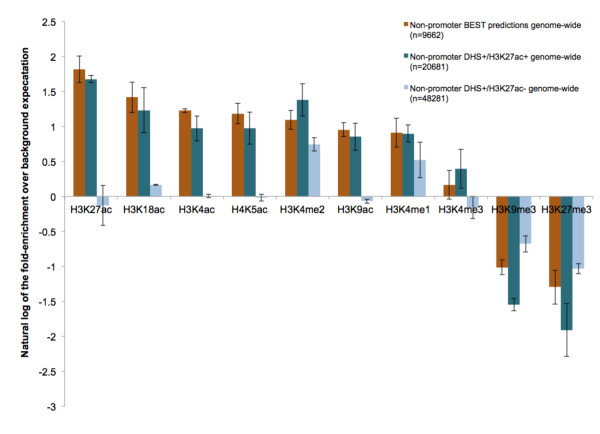
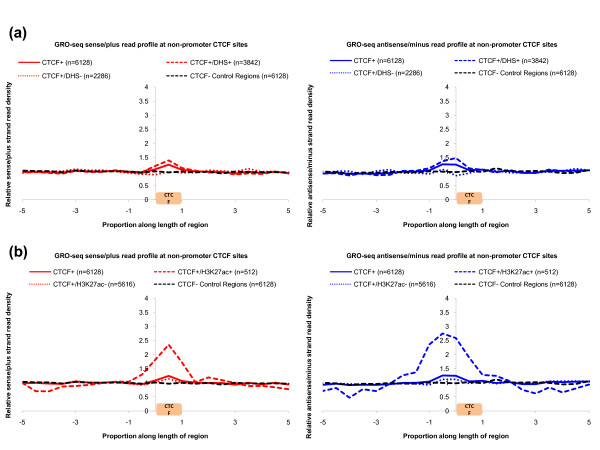
Results: In this study, we developed an in silico approach to model the previously reported phenomenon of transcriptional pausing, accompanied by divergent transcription, at active promoters. We then used this model for large-scale prediction of non-promoter-associated bidirectional expression of short transcripts. Our predictions were significantly enriched for DNase hypersensitive sites, histone H3 lysine 27 acetylation (H3K27ac), and other chromatin marks associated with active rather than poised or repressed enhancers. We also detected modest bidirectional expression at binding sites of the CCCTC-factor (CTCF) genome-wide, particularly those that overlap H3K27ac.

Conclusions: Our findings indicate that the signature of bidirectional expression of short transcripts, learned from promoter-proximal transcriptional pausing, can be used to predict active long-range regulatory elements genome-wide, likely due in part to specific association of RNA polymerase with enhancer regions.


Figures

Figure 1
Figure 1
IMR90 GRO-seq read distribution along the length of actively transcribed genes. As reported previously [10], a significant spike in both sense (orange) and anti-sense (blue) reads is observed near the transcription start site (position 0 - TSS). A smaller spike is evident at the annotated gene end (position 1 - Gene end). As expected, very little GRO-seq signal is observed in non-genic regions (positions less than -0.5 and greater than 1.5), and RNA polymerase-mediated transcription continues past the annotated gene end (positions between 1 and 1.5).
Figure 2
Figure 2
Probability distributions for four of the six features used to train the BEST predictor. Probability distributions are shown for each of four features in non-transcribed (purple), active transcription start sites (TSSs; green), and transcriptional elongation states (orange). Feature #1: normalized sense strand reads density (reads/kb/mapability). Feature #2: normalized antisense strand read density (reads/kb/mapability). Feature #3: ratio of the normalized sense strand read density to that in a 2-kb window immediately 3' of the test window. Feature #4: ratio of the normalized antisense strand read density to that in a 2-kb window just 3' of the test window. (Not shown are feature #5, ratio of the normalized sense strand read density to that in a 2-kb window immediately 5' of the test window, and feature #6, ratio of the normalized antisense strand read density to that in a 2-kb window just 5' of the test window.)
Figure 3
Figure 3
Overlap among non-promoter-associated BEST predictions, DNase hypersensitive sites, and H3K27ac peaks in IMR90 cells. (a) The frequency of overlap (y-axis) is shown between BEST predictions (brown) and DHSs (x-axis; All DHS+), and DHSs that overlap H3K27ac peaks (x-axis; DHS+/H3K27ac+), relative to background expectation (black). Background regions are non-promoter-associated 2-kb windows randomly selected from the genome. P-values were calculated using the two-tailed chi-squared test; *Chi-squared test P-value < 0.00001. (b-d) Overlap between BEST predictions with LOD score > 2.5, DHSs, and H3K27ac peaks, in IMR90 cells is shown at three separate loci: (b) vacuole membrane protein 1 (VMP1) - non-promoter-associated BEST loci (black dashed boxes) are enriched for DHSs and H3K27ac, and depleted of H3K4me3; (c) primary transcript of microRNA let-7a-1 (Pri-let-7a-1) - a BEST locus (black dashed box) upstream of the promoter (green dashed box) lacks both H3K4me3 and H3K79me2 signal, indicating that it is highly unlikely to be an alternative promoter; and (d) La-related protein 1 (LARP1) - a BEST locus (black dashed box) positioned between the annotated promoter (red dashed box) and the likely active promoter (green black box) lacks both H3K4me3 and H3K79me2 peaks, indicating that it is highly unlikely to be an alternative promoter.
Figure 4
Figure 4
BEST signature at IMR90 DNase hypersensitive sites and H3K27ac peak regions in IMR90 cells. (a-c) Signal for BEST (accumulation of GRO-seq sense reads accompanied by anti-sense reads immediately upstream) is shown at IMR90 DHSs located within actively transcribed intragenic regions (a), non-transcribed intragenic regions (b), and intergenic regions (c). Relative sense/plus read density (y-axis) is the sense/plus read density at a particular proportional position divided by the average sense/plus read density in the entire DHS + flanking region. Proportional positions between 0 and 1 on the x-axis correspond to the DHS peak. Positions < 0 and > 1 correspond to flanking regions. IMR90 DHSs and H3K37ac peaks potentially associated with promoters or gene ends were discarded from the analysis. Non-DHS control regions (black) were randomly generated and follow the same size distribution as DHSs.
Figure 5
Figure 5
Relative representation of ten different chromatin marks at predicted BEST loci in IMR90 cells. The natural logarithm (ln) of the fold-enrichment over background (y-axis) is shown for ten different histone modifications at high-confidence BEST predictions (brown), DHS+/H3K27ac+ regions (dark blue), and DHS+/H3K27ac- regions (light blue). Background regions are non-promoter, non-DHS, 2-kb windows randomly selected from the genome. Error bars represent the standard deviation among biological replicates.
Figure 6
Figure 6
BEST signature at IMR90 CCCTC-factor binding regions. (a,b) Signal for BEST (accumulation of GRO-seq sense reads accompanied by anti-sense reads immediately upstream) is shown at non-promoter-associated IMR90 CTCF binding regions stratified by open chromatin loci (DHSs) (a) and H3K27ac peaks (b). Relative sense/plus read density (y-axis) is the sense/plus read density at a particular proportional position divided by the average sense/plus read density in the entire CTCF + flanking region. Proportional positions between 0 and 1 on the x-axis correspond to CTCF binding regions [36]. Positions < 0 and > 1 correspond to flanking regions. IMR90 CTCF binding regions potentially associated with promoters or gene ends were discarded from the analysis. Non-CTCF control regions (black) were randomly generated and follow the same size distribution as IMR90 CTCF binding regions.

References

    1. Maniatis T, Reed R. An extensive network of coupling among gene expression machines. Nature. 2002;416:499–506. doi: 10.1038/416499a. - DOI - PubMed
    1. Komili S, Silver PA. Coupling and coordination in gene expression processes: a systems biology view. Nat Rev Genet. 2008;9:38–48. doi: 10.1038/nrg2223. - DOI - PubMed
    1. Wyrick JJ, Young RA. Deciphering gene expression regulatory networks. Curr Opin Genet Dev. 2002;12:130–136. doi: 10.1016/S0959-437X(02)00277-0. - DOI - PubMed
    1. Kim HD, Shay T, O'Shea EK, Regev A. Transcriptional regulatory circuits: predicting numbers from alphabets. Science. 2009;325:429–432. - PMC - PubMed
    1. Hindorff LA, Sethupathy P, Junkins HA, Ramos EM, Mehta JP, Collins FS, Manolio TA. Potential etiologic and functional implications of genome-wide association loci for human diseases and traits. Proc Natl Acad Sci USA. 2009;106:9362–9367. doi: 10.1073/pnas.0903103106. - DOI - PMC - PubMed

Publication types

LinkOut - more resources