Review
. 2012 Jan;12(1):96-110.
doi: 10.2174/156652412798376134.

Basal breast cancer: a complex and deadly molecular subtype

Affiliations
Free PMC article
Review

Basal breast cancer: a complex and deadly molecular subtype

F Bertucci et al. Curr Mol Med. 2012 Jan.
Free PMC article

Abstract

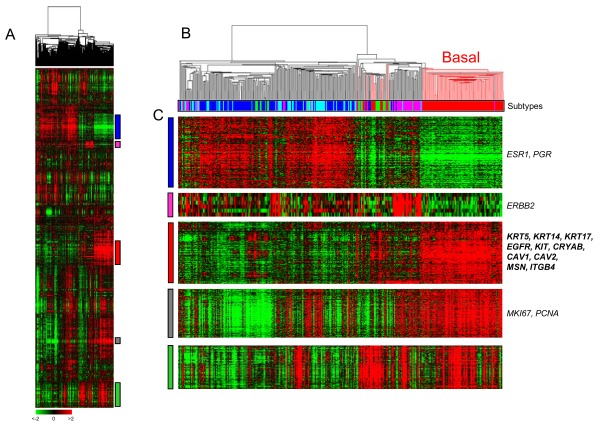
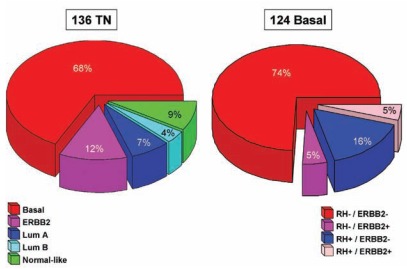
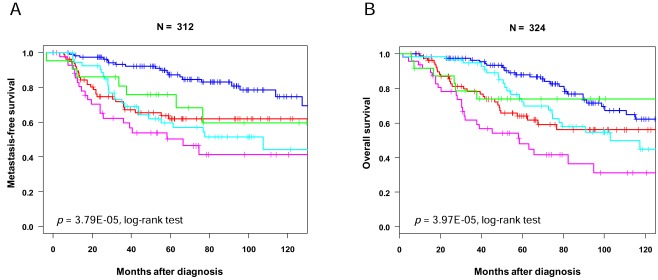
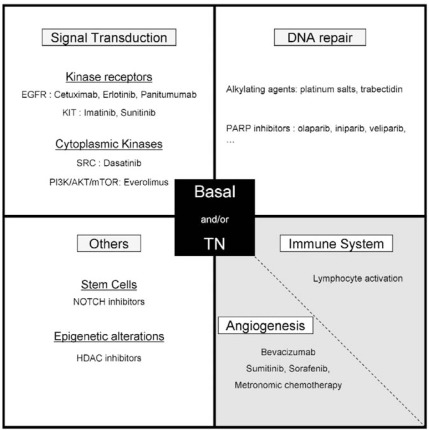
During the last decade, gene expression profiling of breast cancer has revealed the existence of five molecular subtypes and allowed the establishment of a new classification. The basal subtype, which represents 15-25% of cases, is characterized by an expression profile similar to that of myoepithelial normal mammary cells. Basal tumors are frequently assimilated to triple-negative (TN) breast cancers. They display epidemiological and clinico-pathological features distinct from other subtypes. Their pattern of relapse is characterized by frequent and early relapses and visceral locations. Despite a relative sensitivity to chemotherapy, the prognosis is poor. Recent characterization of their molecular features, such as the dysfunction of the BRCA1 pathway or the frequent expression of EGFR, provides opportunities for optimizing the systemic treatment. Several clinical trials dedicated to basal or TN tumors are testing cytotoxic agents and/or molecularly targeted therapies. This review summarizes the current state of knowledge of this aggressive and hard-to-treat subtype of breast cancer.


Figures

Fig. (1). Whole-genome clustering and molecular subtypes.
A/ Hierarchical clustering of 353 breast cancer samples profiled in our institution with 12.304 genes. Each row is a gene and each column a sample. The expression level of each gene in each sample is relative to its median abundance across the samples and is depicted according to the color scale shown under the matrix. Red and green indicate expression levels respectively above and below the median. Above the matrix, the dendrogram shows the degree of similarity between samples. To the right, vertical colored bars indicate gene clusters zoomed in C. B/ Dendrogram of samples. The branches are color-coded according to the molecular subtype: red for basal and black for the other subtypes. Under the dendrogram, the subtypes are color-coded as follows: dark blue, lulinal A; light blue, luminal B; pink, ERBB2; red, basal; green, normal-like. The basal subtype is the most homogeneous subtype. C/ Gene clusters of interest: luminal/ER-related, ERBB2, basal, proliferation and immune clusters. Some genes of interest of four clusters are noted (EntrezGene symbol). (For interpretation of the references to color in this figure legend, the reader is referred to the web version of this paper).
Fig. (2). Overlap between basal breast cancers and TN tumors.
A/ Distribution of molecular subtypes within TN tumors. B/ Distribution of IHC groups (based on HR and ERBB2) within basal tumors. Our database was combined with publicly available MDA data [183]. (For interpretation of the references to color in this figure, the reader is referred to the web version of this paper).
Fig. (3). Survival according to molecular subtypes.
Kaplan-Meier curves for metastasis-free survival (A) and overall survival (B) according to subtypes in our series of 353 patients treated in our institution. The color legend is similar to Fig. (2). (For interpretation of the references to color in this figure, the reader is referred to the web version of this paper).
Fig. (4). Therapeutic strategies under assessment in basal and/or TN breast cancer.
White: tumor cells; light grey: tumor microenvironment.

Similar articles

Cited by

References

    1. Bertucci F, Houlgatte R, Nguyen C, et al. Gene expression profiling of cancer by use of DNA arrays: how far from the clinic? Lancet Oncol. 2001;2:674–82. - PubMed
    1. Sotiriou C, Piccart MJ. Taking gene-expression profiling to the clinic: when will molecular signatures become relevant to patient care? Nat Rev Cancer. 2007;7:545–53. - PubMed
    1. Bertucci F, Finetti P, Cervera N, et al. Gene expression profiling and clinical outcome in breast cancer. Omics. 2006;10:429–43. - PubMed
    1. Perou CM, Sorlie T, Eisen MB, et al. Molecular portraits of human breast tumours. Nature. 2000;406:747–52. - PubMed
    1. Sorlie T, Perou CM, Tibshirani R, et al. Gene expression patterns of breast carcinomas distinguish tumor subclasses with clinical implications. Proc Natl Acad Sci USA. 2001;98:10869–74. - PMC - PubMed

Publication types