

In vitro activities of candidate microbicides against cell-associated HIV
- PMID: 22083472
- PMCID: PMC3264207
- DOI: 10.1128/AAC.05801-11
In vitro activities of candidate microbicides against cell-associated HIV
Abstract
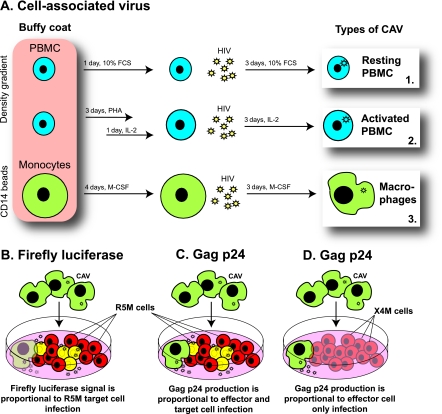
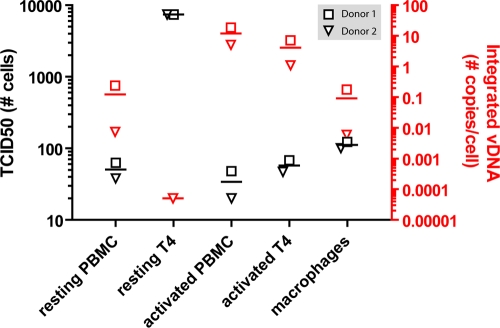
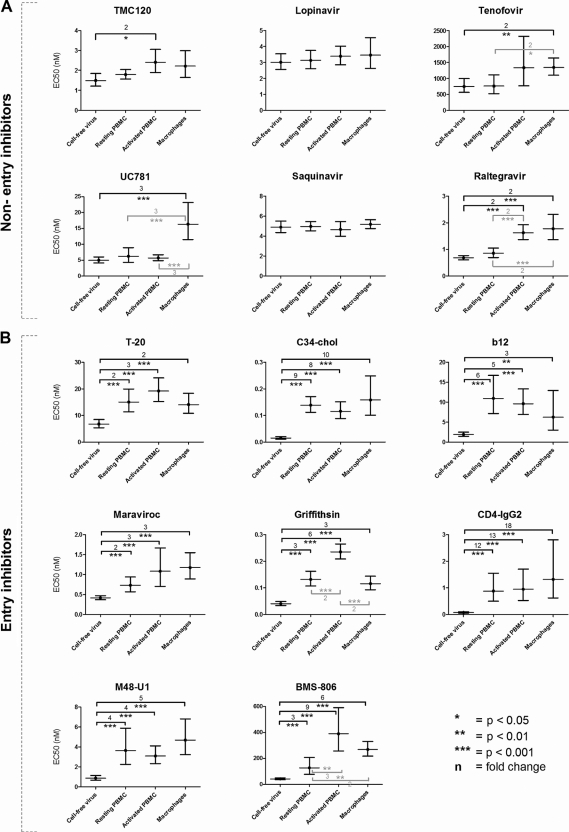
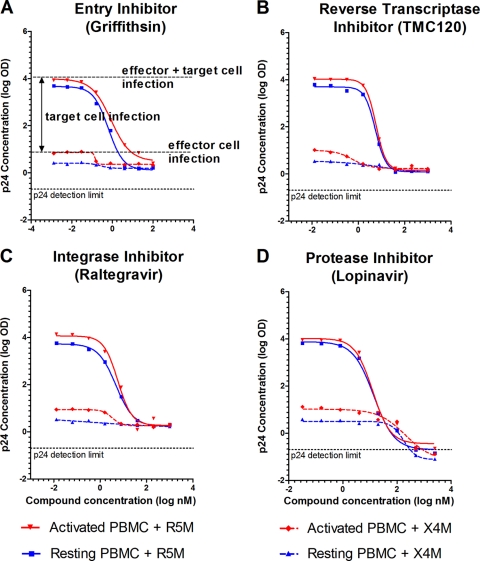
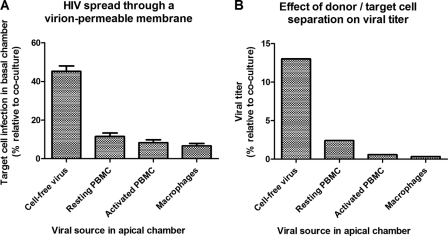
Most research on HIV transmission and microbicides focuses on the inhibition of cell-free virus (CFV) present in genital secretions. However, an effective microbicide should also block the transmission of cell-associated virus (CAV) originating from seminal T cells and macrophages. Because inhibition of CAV remains controversial, especially for viral entry inhibitors, we developed a novel in vitro assay to evaluate the activities of different classes of candidate microbicides against cell-free HIV and HIV-infected leukocytes (i.e., resting peripheral blood mononuclear cells [PBMC], activated PBMC, and monocyte-derived macrophages). The assay is based on two CD4(+) CXCR4(+) T-cell lines (R5MaRBLE and X4MaRBLE) that both contain a firefly luciferase reporter gene but differ in the expression of the CCR5 coreceptor. Consequently, the quantification of the luciferase activities and the Gag p24 concentrations in cocultures of R5-tropic HIV-infected leukocytes with each cell line separately allowed us to discriminate between the infection of the cell lines (i.e., target cells), the ongoing infection in the HIV-infected leukocytes (i.e., effector cells), and the total infection of the coculture (i.e., effector plus target cells). All 14 antiretrovirals tested were able to block target cell infection by all three sources of CAV, although a small decrease in activity (2- to 18-fold) was observed for all entry inhibitors. On the other hand, the production of Gag p24 by the infected effector cells could be blocked only by protease inhibitors. Overall, these results show that entry and protease inhibitors are eligible drug classes for inclusion in future combination microbicides.
Figures
Similar articles
-
Distinct efficacy of HIV-1 entry inhibitors to prevent cell-to-cell transfer of R5 and X4 viruses across a human placental trophoblast barrier in a reconstitution model in vitro.Retrovirology. 2008 Mar 31;5:31. doi: 10.1186/1742-4690-5-31. Retrovirology. 2008. PMID: 18377645 Free PMC article.
-
Palmitic Acid Is a Novel CD4 Fusion Inhibitor That Blocks HIV Entry and Infection.AIDS Res Hum Retroviruses. 2009 Dec;25(12):1231-41. doi: 10.1089/aid.2009.0019. AIDS Res Hum Retroviruses. 2009. PMID: 20001317 Free PMC article.
-
Novel reporter T-cell line highly susceptible to both CCR5- and CXCR4-using human immunodeficiency virus type 1 and its application to drug susceptibility tests.J Clin Microbiol. 2003 Jun;41(6):2515-21. doi: 10.1128/JCM.41.6.2515-2521.2003. J Clin Microbiol. 2003. PMID: 12791875 Free PMC article.
-
Review of HIV antiretroviral drug resistance.Pediatr Infect Dis J. 2008 Aug;27(8):749-52. doi: 10.1097/INF.0b013e3181846e2e. Pediatr Infect Dis J. 2008. PMID: 18664987 Free PMC article. Review. No abstract available.
-
HIV-1 entry and entry inhibitors as therapeutic agents.Clin Lab Med. 2002 Sep;22(3):681-701. doi: 10.1016/s0272-2712(02)00011-2. Clin Lab Med. 2002. PMID: 12244592 Review.
Cited by
-
Efficient single tobamoviral vector-based bioproduction of broadly neutralizing anti-HIV-1 monoclonal antibody VRC01 in Nicotiana benthamiana plants and utility of VRC01 in combination microbicides.Antimicrob Agents Chemother. 2013 May;57(5):2076-86. doi: 10.1128/AAC.02588-12. Epub 2013 Feb 12. Antimicrob Agents Chemother. 2013. PMID: 23403432 Free PMC article.
-
Modeling mucosal cell-associated HIV type 1 transmission in vitro.J Infect Dis. 2014 Dec 15;210 Suppl 3(Suppl 3):S648-53. doi: 10.1093/infdis/jiu537. J Infect Dis. 2014. PMID: 25414419 Free PMC article. Review.
-
Abasic phosphorothioate oligomers inhibit HIV-1 reverse transcription and block virus transmission across polarized ectocervical organ cultures.Antimicrob Agents Chemother. 2014 Dec;58(12):7056-71. doi: 10.1128/AAC.02991-14. Epub 2014 Sep 15. Antimicrob Agents Chemother. 2014. PMID: 25224013 Free PMC article.
-
M48U1 CD4 mimetic has a sustained inhibitory effect on cell-associated HIV-1 by attenuating virion infectivity through gp120 shedding.Retrovirology. 2013 Feb 1;10:12. doi: 10.1186/1742-4690-10-12. Retrovirology. 2013. PMID: 23375046 Free PMC article.
-
Griffithsin protects mice from genital herpes by preventing cell-to-cell spread.J Virol. 2013 Jun;87(11):6257-69. doi: 10.1128/JVI.00012-13. Epub 2013 Mar 27. J Virol. 2013. PMID: 23536670 Free PMC article.
References
-
- Abela IA. 2011. The role of neutralizing antibodies in inhibition of cell-to-cell transmission, abstr 101. Abstr. Keystone Symp. HIV Evol., Genomics Pathog., Whistler, Canada
-
- Allaway GP, et al. 1995. Expression and characterization of CD4-IgG2, a novel heterotetramer that neutralizes primary HIV type 1 isolates. AIDS Res. Hum. Retrovir. 11: 533–539 - PubMed
-
- Ariën KK, Jespers V, Vanham G. 2011. HIV sexual transmission and microbicides. Rev. Med. Virol. 21: 110–133 - PubMed
Publication types
MeSH terms
Substances
LinkOut - more resources
Full Text Sources
Other Literature Sources
Medical
Research Materials
