. 2012:813:57-81.
doi: 10.1007/978-1-61779-412-4_4.

Predicting synthetic gene networks

Affiliations

Predicting synthetic gene networks

Diego di Bernardo et al. Methods Mol Biol. 2012.

Abstract

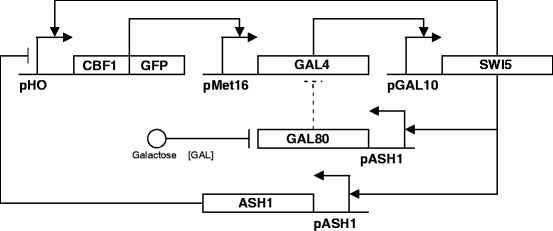
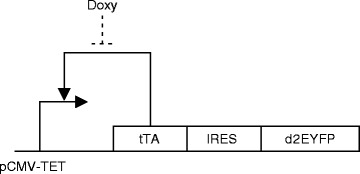
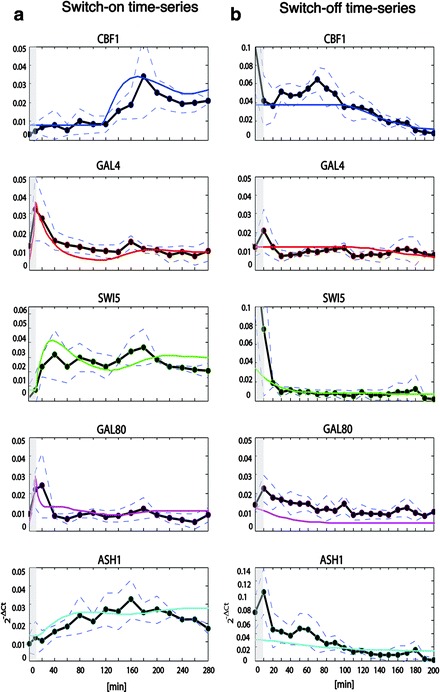
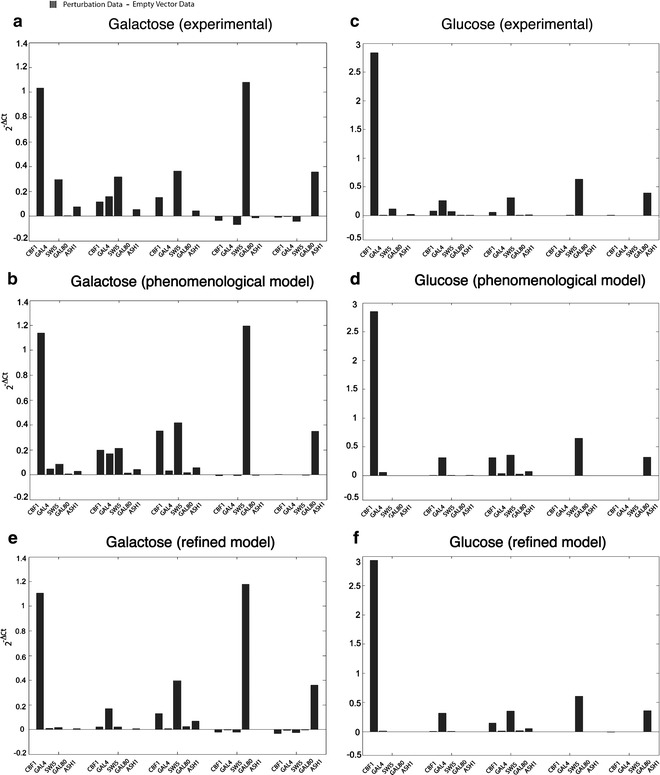
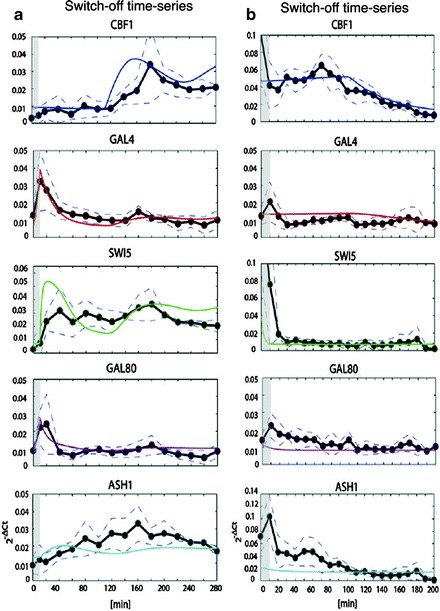
Synthetic biology aims at designing and building new biological functions in living organisms. The complexity of cellular regulation (regulatory, metabolic, and signaling interactions, and their coordinated action) can be tackled via the development of quantitative mathematical models. These models are useful to test biological hypotheses and observations, and to predict the possible behaviors of a synthetic network. Indeed, synthetic biology uses such models to design synthetic networks, prior to their construction in the cell, to perform specific tasks, or to change a biological process in a desired way. The synthetic network is built by assembling biological "parts" taken from different systems; therefore it is fundamental to identify, isolate, and test regulatory motifs which occur frequently in biological pathways. In this chapter, we describe how to model and predict the behavior of synthetic networks in two difference cases: (1) a synthetic network composed of five genes regulating each other through a variety of regulatory interactions in the yeast Saccharomyces cerevisiae (2) a synthetic transcriptional positive feedback loop stably integrated in Human Embryonic Kidney 293 cells (HEK293).


Figures

Fig. 1.
Fig. 1.
Diagram of the synthetic network in yeast. Solid lines model transcriptional interactions while dashed lines are meant to represent protein-protein interactions.
Fig. 2.
Fig. 2.
Design of the positive feedback loop in mammalian cells. The promoter CMV-TET consist of seven direct repeats of a 42-bp sequence containing the tet operator sequences (tetO  ), located just upstream of the minimal CMV promoter (PminCMV  ). The tetracycline-controlled transactivator tTA derives from the addition of the VP16 activation domain to the transcriptional repressor TetR. The d2EYFP is the destabilized yellow-green variant of enhanced green fluorescent protein with a half-life of approximately 2 h.
Fig. 3.
Fig. 3.
Identification and validation results of time-series, phenomenological model. Circles represent average expression data for each of the IRMA genes at different time points. Dashed lines represent standard errors. solid lines represent in silico data. (a) Identification results of the phenomenological model on the average 5 h “switch-on” time-series. (b) Validation of the phenomenological model on the average 3 h “switch-off” dataset.
Fig. 4.
Fig. 4.
Experimental and simulated overexpression experiments (a, c). In vivo expression levels of IRMA genes after overexpression of each gene (perturbed gene; indicated by the black dots on the bars) from the constitutive GPD promoter (gray bars) and after transformation of the empty vector (white bars). IRMA cells were transformed with each of the constructs containing one of the five genes or with the empty vector. At least, three difierent colonies were grown in glucose (b) and in galactose-rafinose (a) up to the steady-state levels of gene expression. Quantitative PCR data are represented (average data from different colonies) (b, d). In silico expressionlevels of IRMA genes obtained by simulating the overexpression of each gene with the phenomenological model (e, f). In silico expression levels of IRMA genes obtained by simulating the overexpression of each gene with the refined model.
Fig. 5.
Fig. 5.
Identification and validation results of time-series, phenomenological model. Circles represent average expression data for each of the IRMA genes at different time points. Dashed lines represent standard errors. Solid lines represent in silico data. (a) Identification results of the phenomenological model on the average 5 h “switch-on” time-series. (b) Validation of the refined model on the average 3 h “switch-off” dataset.
Fig. 6.
Fig. 6.
Dynamical behavior of the positive feedback loop in mammalian cells. In this figure model predictions of the dynamics characterizing the circuit for varying concentrations of Doxycycline (1 μg/mL for (a) and (c), 100 ng/mL for (b) and 10 μg/mL for (d)) have been reported. The sample time is equal to 15 min. The cells were treated with the antibiotic at t  =  0 (min). Model predictions are reported in with thick line while experimental results are represented in blue. In (a), the cells were kept at 37°C and observed up to 37 h. In (bd) the cells were kept at 32°C and observed up to 61 h. In (e) we report the comparison of the dynamics of the circuit obtained by varying the strength of the positive feedback loop. C line = model simulation of the system including the positive feedback loop using the inferred parameter values (Table 2). B line = model simulation of the system reducing the strength of the positive feedback loop. A line = model simulation of the system removing the positive feedback loop.

References

    1. Cuccato G. Systems and Synthetic biology: tackling genetic networks and complex diseases. Heredity. 2009;102:527–532. - PubMed
    1. Mangan S., Alon U. Structure and function of the feed-forward loop network motif. Proc Natl Acad Sci USA. 2003;100:11980–11985. - PMC - PubMed
    1. Cantone I., Marucci L., Iorio F., Ricci M. A., Belcastro V., Bansal M., Santini S., Bernardo M., Bernardo D., Cosma M. P. A yeast synthetic network for in vivo assessment of reverse-engineering and modeling approaches. Cell. 2009;137:172–181. - PubMed
    1. Gossen M., Bujard H. Tight control of gene expression in mammalian cells by tetracycline-responsive promoters. Proc Natl Acad Sci USA. 1992;89:5547–5551. - PMC - PubMed
    1. Dull T., Zufferey R., Kelly M., Mandel R. J., Nguyen M., Trono D., Naldini L. A third-generation lentivirus vector with a conditional packaging system. J Virol. 1998;72:8463–8471. - PMC - PubMed

MeSH terms

LinkOut - more resources