. 2012 May;67(5):1252-65.
doi: 10.1002/mrm.23103. Epub 2011 Nov 14.

Reduced resolution transit delay prescan for quantitative continuous arterial spin labeling perfusion imaging

Affiliations

Reduced resolution transit delay prescan for quantitative continuous arterial spin labeling perfusion imaging

Weiying Dai et al. Magn Reson Med. 2012 May.

Abstract

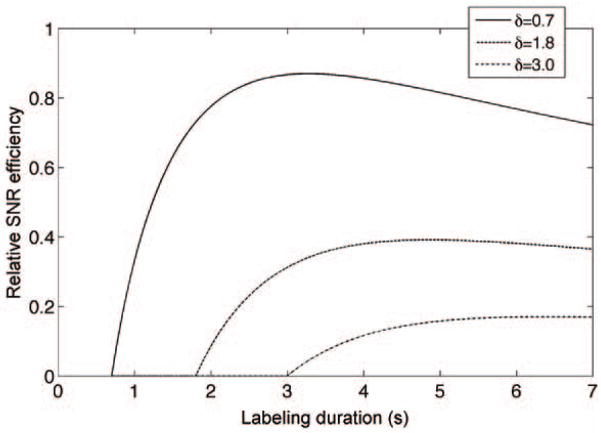
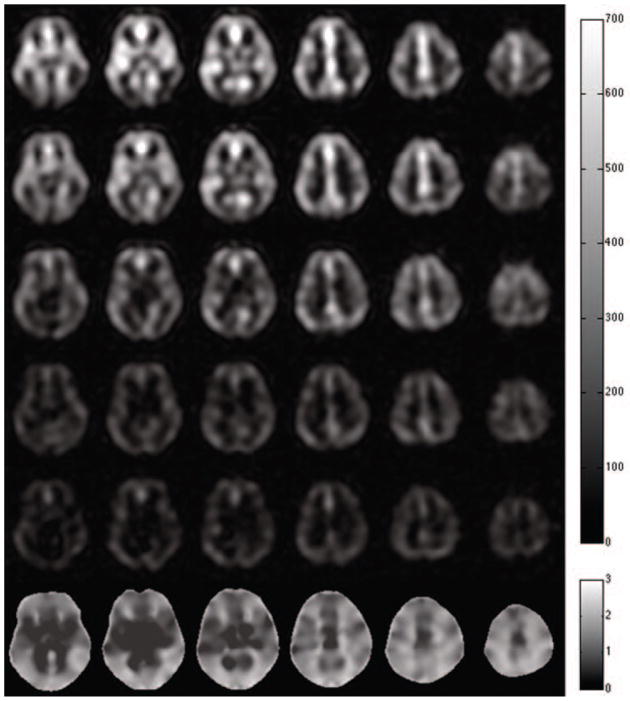
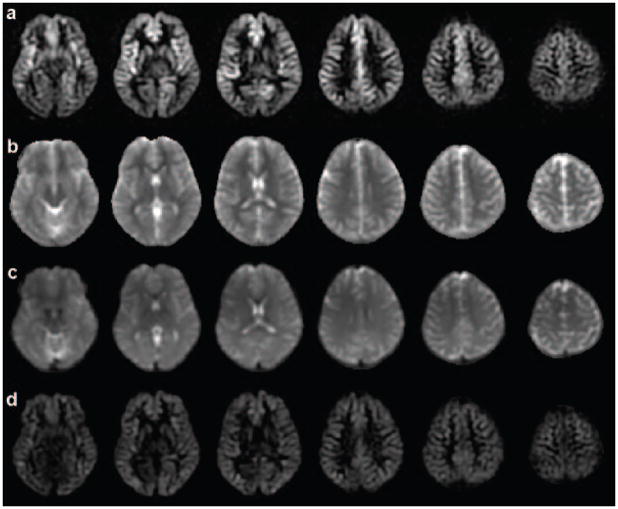
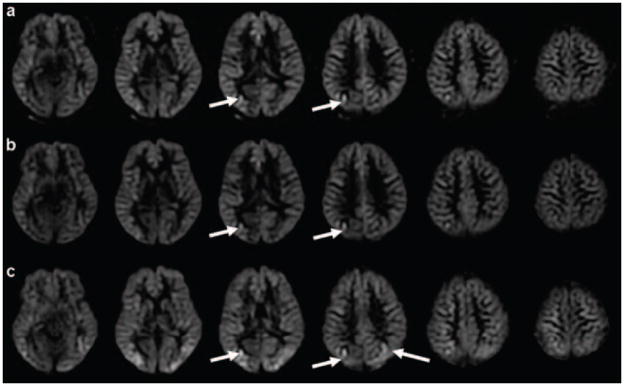
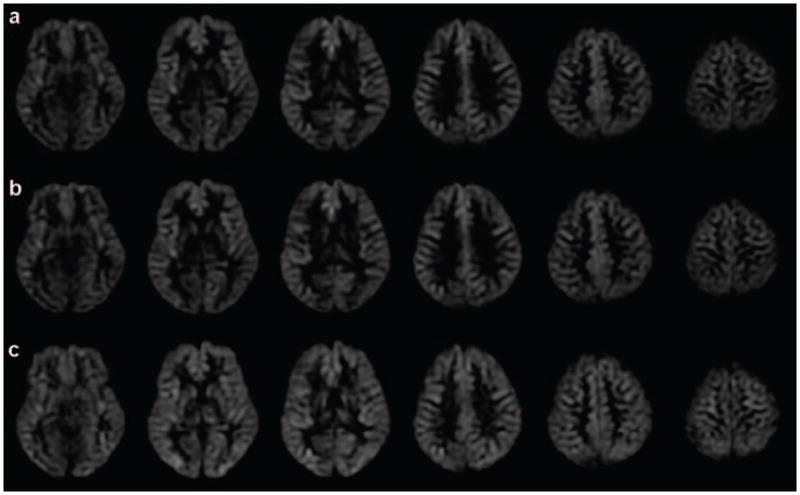
Arterial spin labeling perfusion MRI can suffer from artifacts and quantification errors when the time delay between labeling and arrival of labeled blood in the tissue is uncertain. This transit delay is particularly uncertain in broad clinical populations, where reduced or collateral flow may occur. Measurement of transit delay by acquisition of the arterial spin labeling signal at many different time delays typically extends the imaging time and degrades the sensitivity of the resulting perfusion images. Acquisition of transit delay maps at the same spatial resolution as perfusion images may not be necessary, however, because transit delay maps tend to contain little high spatial resolution information. Here, we propose the use of a reduced spatial resolution arterial spin labeling prescan for the rapid measurement of transit delay. Approaches to using the derived transit delay information to optimize and quantify higher resolution continuous arterial spin labeling perfusion images are described. Results in normal volunteers demonstrate heterogeneity of transit delay across different brain regions that lead to quantification errors without the transit maps and demonstrate the feasibility of this approach to perfusion and transit delay quantification.


Figures

Figure 1
Figure 1
Theoretical dependence of SNR efficiency on the labeling duration for different transit delays. A tissue T1 of 1.5 s, a blood T1 of 1.66 s and a post-labeling delay of 0.7 s were assumed.
Figure 2
Figure 2
(a) A schematic of the long labeling sequence combined with background suppression. The selective region of the 90° saturation pulse and two 180° selective pulses are the imaging region with extension to the labeling plane. The 90° inferior saturation pulse acts on the region below the labeling plane. The control and label block are comprised of rapidly repeated gradient and RF pulses in PCASL; and (b) Vessel suppression sequence diagam. The middle two 180° pulses are adiabatic pulses, which are less sensitive to B0 and B1 inhomogeneities. 400 μs gaps were used after the gradients (shown as the dashed lines) to reduce the effect of eddy currents. A gap between the second and third segments of gradient was added to satisfy the gradient echo condition. The sequence was applied just before the spiral acquisition in (a).
Figure 3
Figure 3
Theoretical signal weighted delay as a monotonically increasing function of transit delay. A tissue T1 of 1.5 s and a blood T1 of 1.66 s were assumed.
Figure 4
Figure 4
Images obtained from high-resolution and low-resolution transit delay acquisitions: (a) transit delay map with high-resolution acquisition, in seconds; (b) transit delay map with low-resolution acquisition, in seconds; (c) subtraction images between high-resolution and low-resolution images (multiplied by 3 for better visibility), in seconds; (d) R square map from the fitting of high-resolution acquisitions; (e) R square map from the fitting of low-resolution acquisition.
Figure 5
Figure 5
The subtraction images, in arbitrary units, with constant labeling duration of 2.0 s but different delays: (a) 0.7 s, (b)1.3 s, (c) 1.9 s, (d) 2.3 s, (e) 3.0 s respectively, and (f) the transit delay map, in seconds, calculated from the subtraction images of multiple different delays.
Figure 6
Figure 6
The images from the short delay: (a) subtraction images from control and label pairs; (b) T1 map calculated from two reference images; (c) proton density map calculated from two reference images; (d) perfusion images with transit delay correction.
Figure 7
Figure 7
The images without vessel suppression obtained with the optimal delay (the post-labeling delay calculated from multiple delay prescan): (a) subtraction images from control and label pairs; (b) perfusion images with the standard quantification; (c) perfusion images with transit delay correction. The bright vessel signals (pointed by arrows) can be seen both in the difference image and the quantified perfusion images.
Figure 8
Figure 8
The images with vessel suppression from the optimal delay (the postlabeling delay calculated from multiple delay prescan): (a) subtraction images from control and label pairs; (b) perfusion images with the standard quantification; (c) perfusion images with transit delay correction.
Figure 9
Figure 9
The effect of tissue T1 on the calculated transit delay (using the signal weighted delay algorithm) when the tissue T1 is deviated from the assumed T1 of 1.5 s: T1t = 1.8 s (solid red) and T1t = 1.2 s (solid blue) with labeling duration of 2 s used for our multiple-delay prescan. With the same multiple delays but labeling duration of 0.6 s, calculated transit delay shows the reduced tissue T1 sensitivity for T1t = 1.8 s (dashed red) and T1t = 1.2 s (dashed blue).

References

    1. Alsop DC, Detre JA, Grossman M. Assessment of cerebral blood flow in Alzheimer’s disease by spin-labeled magnetic resonance imaging. Annals of Neurology. 2000;47(1):93–100. - PubMed
    1. Detre JA, Alsop DC, Vives LR, Maccotta L, Teener JW, Raps EC. Noninvasive MRI evaluation of cerebral blood flow in cerebrovascular disease. Neurology. 1998;50(3):633–641. - PubMed
    1. Chalela JA, Alsop DC, Gonzalez-Atavales JB, Maldjian JA, Kasner SE, Detre JA. Magnetic resonance perfusion imaging in acute ischemic stroke using continuous arterial spin labeling. Stroke. 2000;31(3):680–687. - PubMed
    1. Calamante F, Gadian DG, Connelly A. Quantification of perfusion using bolus tracking magnetic resonance imaging in stroke: assumptions, limitations, and potential implications for clinical use. Stroke. 2002;33(4):1146–1151. - PubMed
    1. MacIntosh BJ, Lindsay AC, Kylintireas I, Kuker W, Gunther M, Robson MD, Kennedy J, Choudhury RP, Jezzard P. Multiple inflow pulsed arterial spin-labeling reveals delays in the arterial arrival time in minor stroke and transient ischemic attack. AJNR Am J Neuroradiol. 2010;31(10):1892–1894. - PMC - PubMed

Publication types