

Assessment of individual radionuclide distributions from the Fukushima nuclear accident covering central-east Japan
- PMID: 22084070
- PMCID: PMC3241760
- DOI: 10.1073/pnas.1111724108
Assessment of individual radionuclide distributions from the Fukushima nuclear accident covering central-east Japan
Abstract
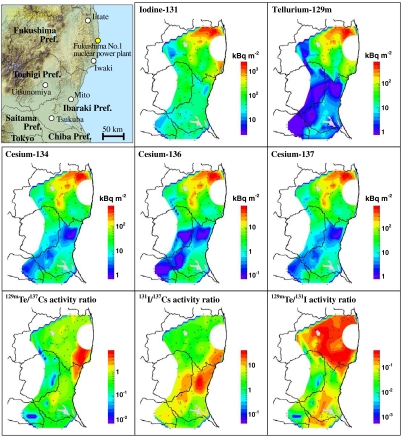
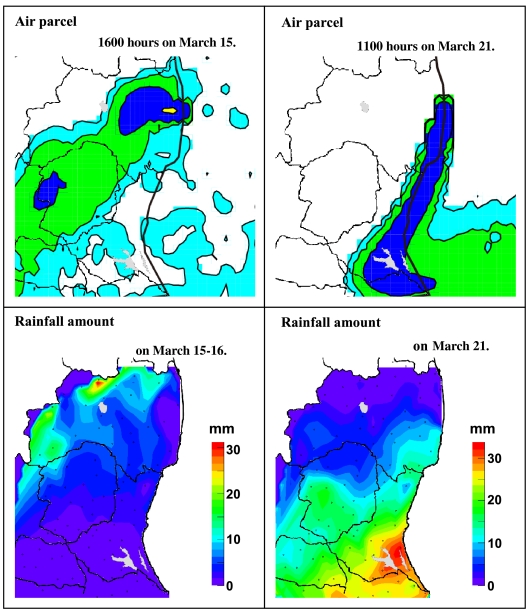
A tremendous amount of radioactivity was discharged because of the damage to cooling systems of nuclear reactors in the Fukushima No. 1 nuclear power plant in March 2011. Fukushima and its adjacent prefectures were contaminated with fission products from the accident. Here, we show a geographical distribution of radioactive iodine, tellurium, and cesium in the surface soils of central-east Japan as determined by gamma-ray spectrometry. Especially in Fukushima prefecture, contaminated area spreads around Iitate and Naka-Dori for all the radionuclides we measured. Distributions of the radionuclides were affected by the physical state of each nuclide as well as geographical features. Considering meteorological conditions, it is concluded that the radioactive material transported on March 15 was the major contributor to contamination in Fukushima prefecture, whereas the radioactive material transported on March 21 was the major source in Ibaraki, Tochigi, Saitama, and Chiba prefectures and in Tokyo.
Conflict of interest statement
N.K. notes that sampling and measurement were done while at University of Tsukuba, and data analyses (calculation of radioactivity and drawing of contour map of radioactivity) were performed while at Shimizu Corporation.
Figures
Comment in
-
Improving the scientific foundations for estimating health risks from the Fukushima incident.Proc Natl Acad Sci U S A. 2011 Dec 6;108(49):19447-8. doi: 10.1073/pnas.1117296108. Epub 2011 Nov 22. Proc Natl Acad Sci U S A. 2011. PMID: 22109550 Free PMC article. No abstract available.
References
-
- Pranesha T-S, Kamra A-K. Scavenging of aerosol particles by large water drops 3. Washout coefficients, half-lives, and rainfall depths. J Geophys Res. 1997;102:23947–23954.
-
- Maqua M, Bonka H, Horn H-G. Deposition velocity and washout coefficient of radionuclides bound to aerosol particles and elemental radioiodine. Radiat Prot Dosim. 1987;21:43–49.
-
- Muramatsu Y, Sumiya M, Ohmono Y. Iodine-131 and other radionuclides in environmental samples collected from Ibaraki/Japan after the Chernobyl accident. Sci Total Environ. 1987;67:149–158. - PubMed
-
- Draxler R, Rolph G. Silver Spring, MD: NOAA Air Resources Laboratory; 2003. Hybrid Single-Particle Lagrangian Integrated Trajectory (HYSPLIT4) model. Available at: http://www.arl.noaa.gov/ready/hysplit4.html.
-
- Reineking A, Becker K-H, Porstendörfer J, Wicke A. Air activity concentration and particle size distributions of the Chernobyl aerosol. Radiat Prot Dosim. 1987;19:159–163.
Publication types
MeSH terms
Substances
LinkOut - more resources
Full Text Sources
Medical
