Modeling rotavirus strain dynamics in developed countries to understand the potential impact of vaccination on genotype distributions
- PMID: 22084114
- PMCID: PMC3228484
- DOI: 10.1073/pnas.1110507108
Modeling rotavirus strain dynamics in developed countries to understand the potential impact of vaccination on genotype distributions
Abstract
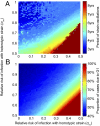
Understanding how immunity shapes the dynamics of multistrain pathogens is essential in determining the selective pressures imposed by vaccines. There is currently much interest in elucidating the strain dynamics of rotavirus to determine whether vaccination may lead to the replacement of vaccine-type strains. In developed countries, G1P[8] strains constitute the majority of rotavirus infections most years, but occasionally other genotypes dominate for reasons that are not well understood. We developed a mathematical model to examine the interaction of five common rotavirus genotypes. We explored a range of estimates for the relative strength of homotypic vs. heterotypic immunity and compared model predictions against observed genotype patterns from six countries. We then incorporated vaccination in the model to examine its impact on rotavirus incidence and the distribution of strains. Our model can explain the coexistence and cyclical pattern in the distribution of genotypes observed in most developed countries. The predicted frequency of cycling depends on the relative strength of homotypic vs. heterotypic immunity. Vaccination that provides strong protection against G1 and weaker protection against other strains will likely lead to an increase in the relative prevalence of non-G1 strains, whereas a vaccine that provides equally strong immunity against all strains may promote the continued predominance of G1. Overall, however, disease incidence is expected to be substantially reduced under both scenarios and remain below prevaccination levels despite the possible emergence of new strains. Better understanding of homotypic vs. heterotypic immunity, both natural and vaccine-induced, will be critical in predicting the impact of vaccination.
Conflict of interest statement
The authors declare no conflict of interest.
Figures


Similar articles
-
Did Large-Scale Vaccination Drive Changes in the Circulating Rotavirus Population in Belgium?Sci Rep. 2015 Dec 21;5:18585. doi: 10.1038/srep18585. Sci Rep. 2015. PMID: 26687288 Free PMC article.
-
Rotavirus G and P types circulating in Brazil: characterization by RT-PCR, probe hybridization, and sequence analysis.Arch Virol. 1996;141(12):2365-74. doi: 10.1007/BF01718637. Arch Virol. 1996. PMID: 9526543
-
Dynamics of G2P[4] strain evolution and rotavirus vaccination: A review of evidence for Rotarix.Vaccine. 2020 Jul 31;38(35):5591-5600. doi: 10.1016/j.vaccine.2020.06.059. Epub 2020 Jul 7. Vaccine. 2020. PMID: 32651115 Review.
-
G1P[8] species A rotavirus over 27 years--pre- and post-vaccination eras--in Brazil: full genomic constellation analysis and no evidence for selection pressure by Rotarix® vaccine.Infect Genet Evol. 2015 Mar;30:206-218. doi: 10.1016/j.meegid.2014.12.030. Epub 2015 Jan 3. Infect Genet Evol. 2015. PMID: 25562122
-
Rotavirus immune responses and correlates of protection.Curr Opin Virol. 2012 Aug;2(4):419-25. doi: 10.1016/j.coviro.2012.05.003. Epub 2012 Jun 5. Curr Opin Virol. 2012. PMID: 22677178 Free PMC article. Review.
Cited by
-
Human rotavirus strains circulating in Venezuela after vaccine introduction: predominance of G2P[4] and reemergence of G1P[8].Virol J. 2017 Mar 21;14(1):58. doi: 10.1186/s12985-017-0721-9. Virol J. 2017. PMID: 28320411 Free PMC article.
-
Genetic diversity of enteric viruses responsible of gastroenteritis in urban and rural Burkina Faso.PLoS Negl Trop Dis. 2024 Jul 8;18(7):e0012228. doi: 10.1371/journal.pntd.0012228. eCollection 2024 Jul. PLoS Negl Trop Dis. 2024. PMID: 38976836 Free PMC article.
-
Long-term variation in influenza A virus prevalence and subtype diversity in migratory mallards in northern Europe.Proc Biol Sci. 2014 Feb 26;281(1781):20140098. doi: 10.1098/rspb.2014.0098. Print 2014 Apr 22. Proc Biol Sci. 2014. PMID: 24573857 Free PMC article.
-
Rotavirus Genotypes in the Postvaccine Era: A Systematic Review and Meta-analysis of Global, Regional, and Temporal Trends by Rotavirus Vaccine Introduction.J Infect Dis. 2024 May 15;229(5):1460-1469. doi: 10.1093/infdis/jiad403. J Infect Dis. 2024. PMID: 37738554 Free PMC article.
-
Mechanistic Models of Infectious Disease and Their Impact on Public Health.Am J Epidemiol. 2016 Mar 1;183(5):415-22. doi: 10.1093/aje/kww021. Epub 2016 Feb 17. Am J Epidemiol. 2016. PMID: 26893297 Free PMC article.
References
-
- Grenfell BT, et al. Unifying the epidemiological and evolutionary dynamics of pathogens. Science. 2004;303:327–332. - PubMed
-
- Andreasen V, Lin J, Levin SA. The dynamics of cocirculating influenza strains conferring partial cross-immunity. J Math Biol. 1997;35:825–842. - PubMed
-
- Castillo-Chavez C, Hethcote HW, Andreasen V, Levin SA, Liu WM. Epidemiological models with age structure, proportionate mixing, and cross-immunity. J Math Biol. 1989;27:233–258. - PubMed
-
- Lin J, Andreasen V, Levin SA. Dynamics of influenza A drift: The linear three-strain model. Math Biosci. 1999;162:33–51. - PubMed
Publication types
MeSH terms
Substances
Grants and funding
LinkOut - more resources
Full Text Sources
Medical

