

Characterization and inference of gene gain/loss along burkholderia evolutionary history
- PMID: 22084562
- PMCID: PMC3210638
- DOI: 10.4137/EBO.S7510
Characterization and inference of gene gain/loss along burkholderia evolutionary history
Abstract
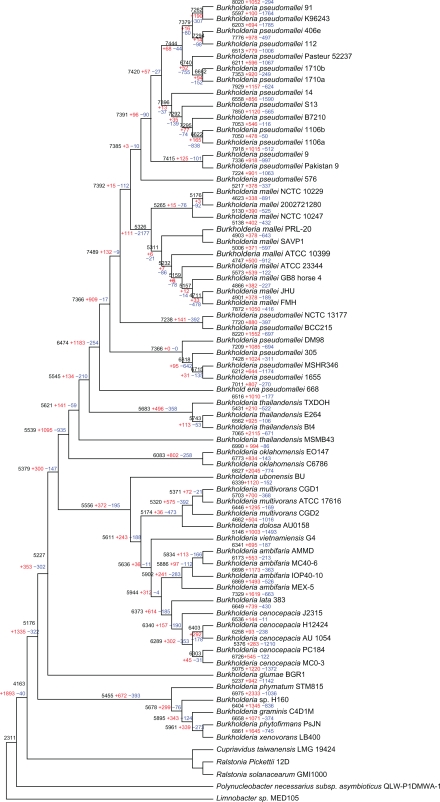
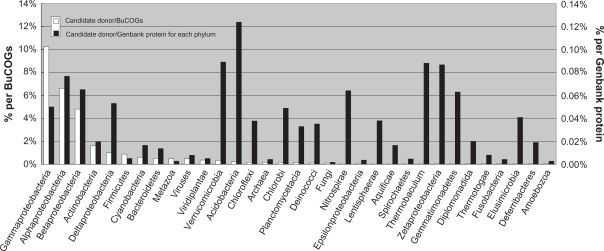
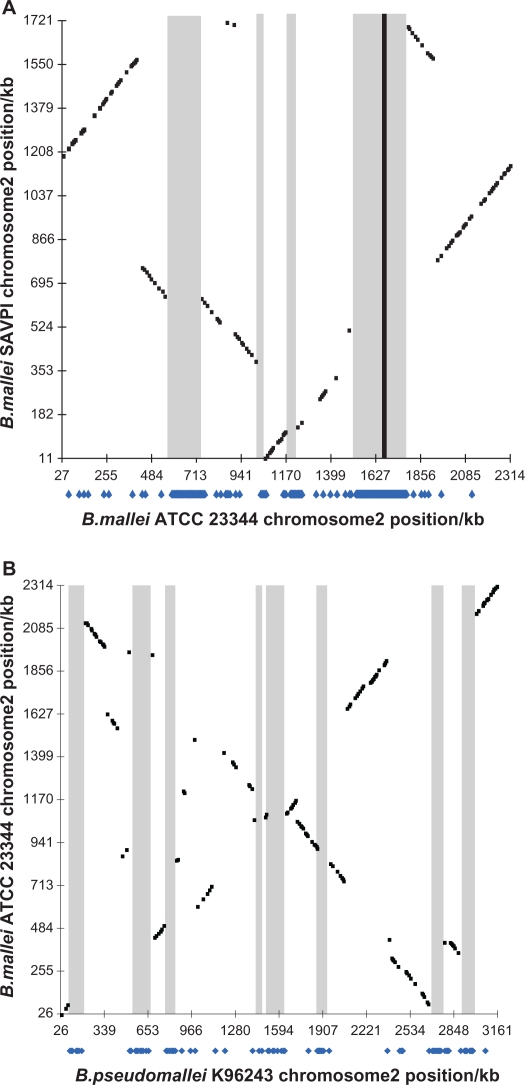
A comparative analysis of 60 complete Burkholderia genomes was conducted to obtain insight in the evolutionary history behind the diversity and pathogenicity at species level. A concatenated multiprotein phyletic pattern and a dataset with Burkholderia clusters of orthologous genes (BuCOGs) were constructed. The extent of horizontal gene transfer (HGT) was assessed using a Markov based probabilistic method. A reconstruction of the gene gains and losses history shows that more than half of the Burkholderia genes families are inferred to have experienced HGT at least once during their evolution. Further analysis revealed that the number of gene gain and loss was correlated with the branch length. Genomic islands (GEIs) analysis based on evolutionary history reconstruction not only revealed that most genes in ancient GEIs were gained but also suggested that the fraction of the genome located in GEIs in the small chromosomes is higher than in the large chromosomes in Burkholderia. The mapping of coexpressed genes onto biological pathway schemes revealed that pathogenicity of Burkholderia strains is probably mainly determined by the gained genes in its ancestor. Taken together, our results strongly support that gene gain and loss especially in ancient evolutionary history play an important role in strain divergence, pathogenicity determinants of Burkholderia and GEIs formation.
Keywords: Burkholderia; Markov model; coexpression; gene gain/loss; genomic island.
Figures
Similar articles
-
Algorithms for computing parsimonious evolutionary scenarios for genome evolution, the last universal common ancestor and dominance of horizontal gene transfer in the evolution of prokaryotes.BMC Evol Biol. 2003 Jan 6;3:2. doi: 10.1186/1471-2148-3-2. Epub 2003 Jan 6. BMC Evol Biol. 2003. PMID: 12515582 Free PMC article.
-
Inference and characterization of horizontally transferred gene families using stochastic mapping.Mol Biol Evol. 2010 Mar;27(3):703-13. doi: 10.1093/molbev/msp240. Epub 2009 Oct 6. Mol Biol Evol. 2010. PMID: 19808865 Free PMC article.
-
Identification of a Genomic Island of Actinobacillus actinomycetemcomitans.J Periodontol. 2005 Nov;76 Suppl 11S:2052-2060. doi: 10.1902/jop.2005.76.11-S.2052. J Periodontol. 2005. PMID: 29539054
-
The genomic organization of plant pathogenicity in Fusarium species.Curr Opin Plant Biol. 2010 Aug;13(4):420-6. doi: 10.1016/j.pbi.2010.04.004. Epub 2010 May 13. Curr Opin Plant Biol. 2010. PMID: 20471307 Review.
-
MarR Family Transcription Factors from Burkholderia Species: Hidden Clues to Control of Virulence-Associated Genes.Microbiol Mol Biol Rev. 2018 Nov 28;83(1):e00039-18. doi: 10.1128/MMBR.00039-18. Print 2019 Mar. Microbiol Mol Biol Rev. 2018. PMID: 30487164 Free PMC article. Review.
Cited by
-
Complete Genome Sequence of Massilia oculi sp. nov. CCUG 43427T (=DSM 26321T), the Type Strain of M. oculi, and Comparison with Genome Sequences of Other Massilia Strains.Curr Microbiol. 2019 Sep;76(9):1082-1086. doi: 10.1007/s00284-018-1597-7. Epub 2018 Nov 15. Curr Microbiol. 2019. PMID: 30443686
-
Global patterns of protein domain gain and loss in superkingdoms.PLoS Comput Biol. 2014 Jan 30;10(1):e1003452. doi: 10.1371/journal.pcbi.1003452. eCollection 2014 Jan. PLoS Comput Biol. 2014. PMID: 24499935 Free PMC article.
-
Molecular signatures and phylogenomic analysis of the genus Burkholderia: proposal for division of this genus into the emended genus Burkholderia containing pathogenic organisms and a new genus Paraburkholderia gen. nov. harboring environmental species.Front Genet. 2014 Dec 19;5:429. doi: 10.3389/fgene.2014.00429. eCollection 2014. Front Genet. 2014. PMID: 25566316 Free PMC article.
-
Updated clusters of orthologous genes for Archaea: a complex ancestor of the Archaea and the byways of horizontal gene transfer.Biol Direct. 2012 Dec 14;7:46. doi: 10.1186/1745-6150-7-46. Biol Direct. 2012. PMID: 23241446 Free PMC article.
-
Tal1NXtc01 in Xanthomonas translucens pv. cerealis Contributes to Virulence in Bacterial Leaf Streak of Wheat.Front Microbiol. 2019 Sep 4;10:2040. doi: 10.3389/fmicb.2019.02040. eCollection 2019. Front Microbiol. 2019. PMID: 31551976 Free PMC article.
References
-
- Compant S, Nowak J, Coenye T, Clement C, Barka EA. Diversity and occurrence of Burkholderia spp. in the natural environment. FEMS Microbiol Rev. 2008;32:607–26. - PubMed
-
- Chiarini L, Bevivino A, Dalmastri C, Tabacchioni S, Visca P. Burkholderia cepacia complex species: health hazards and biotechnological potential. Trends Microbiol. 2006;14:277–86. - PubMed
-
- Coenye T, Vandamme P. Diversity and significance of Burkholderia species occupying diverse ecological niches. Environ Microbiol. 2003;5:719–29. - PubMed
-
- Mahenthiralingam E, Urban TA, Goldberg JB. The multifarious, multireplicon Burkholderia cepacia complex. Nat Rev Microbiol. 2005;3:144–56. - PubMed
-
- Zhang L, Xie G. Diversity and distribution of Burkholderia cepacia complex in the rhizosphere of rice and maize. FEMS Microbiol Lett. 2007;266:231–5. - PubMed
LinkOut - more resources
Full Text Sources
