. 2012 Aug 10;21(12):2222-38.
doi: 10.1089/scd.2011.0596. Epub 2012 Feb 7.

An in vivo characterization of trophic factor production following neural precursor cell or bone marrow stromal cell transplantation for spinal cord injury

Affiliations

An in vivo characterization of trophic factor production following neural precursor cell or bone marrow stromal cell transplantation for spinal cord injury

Gregory W J Hawryluk et al. Stem Cells Dev. .

Abstract

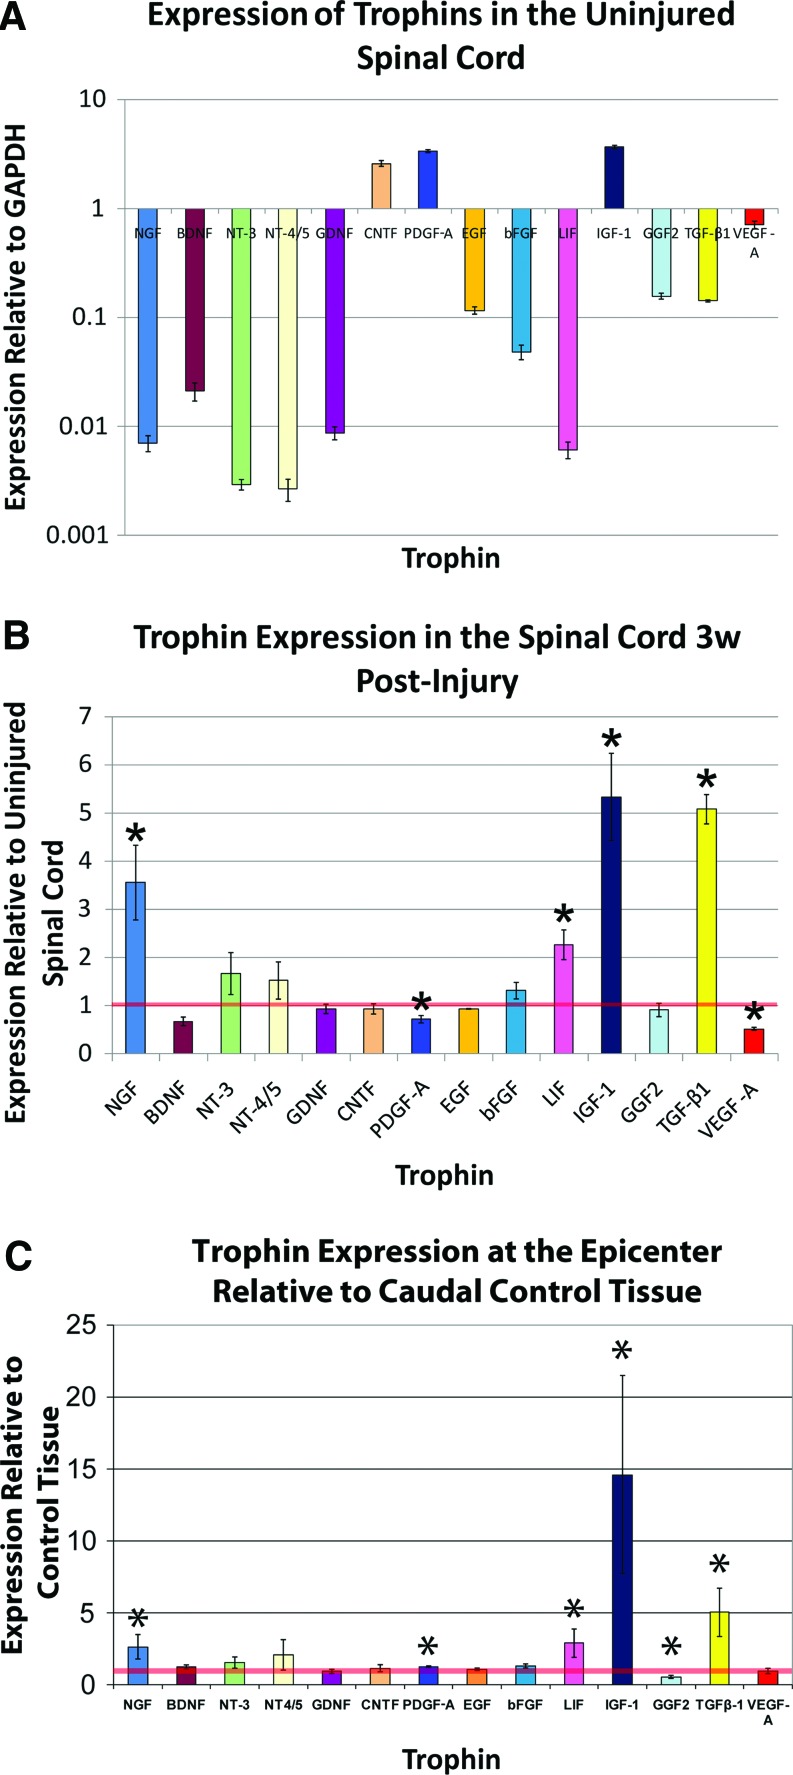
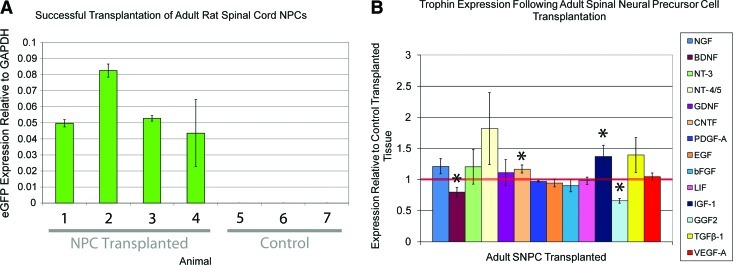
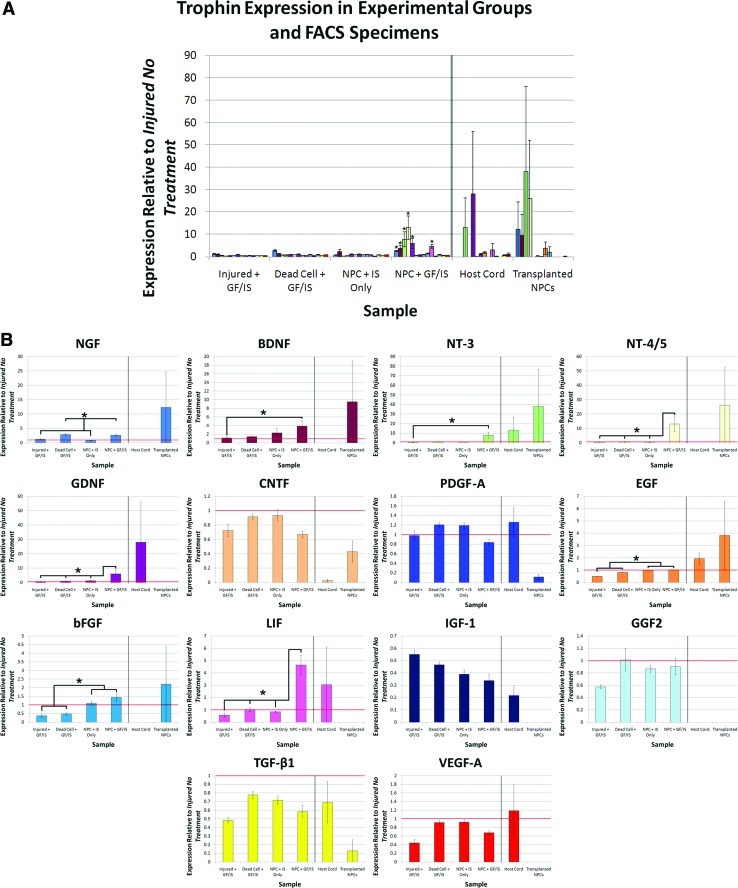
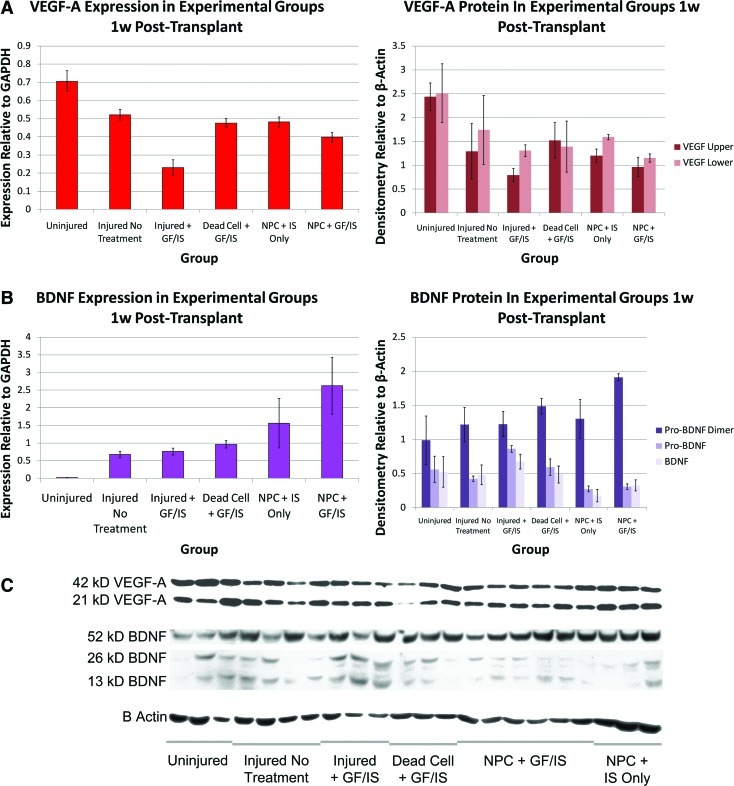
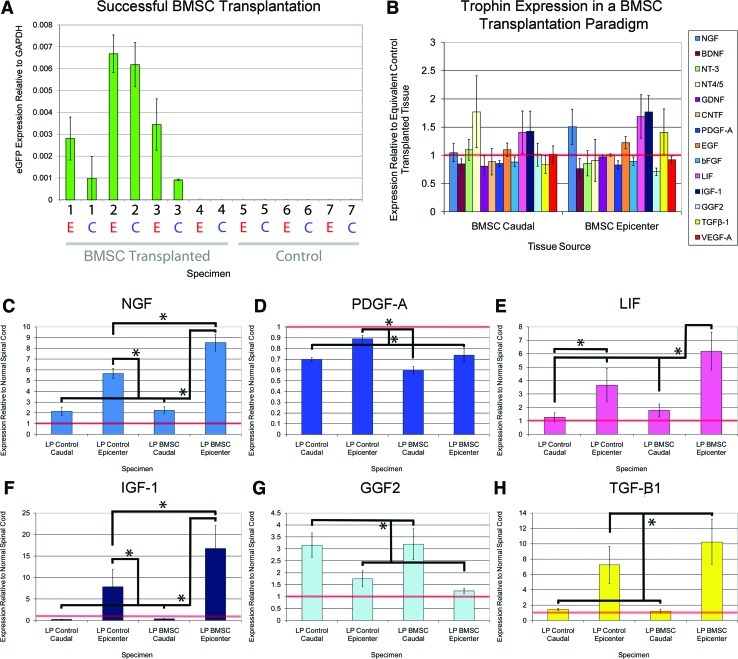
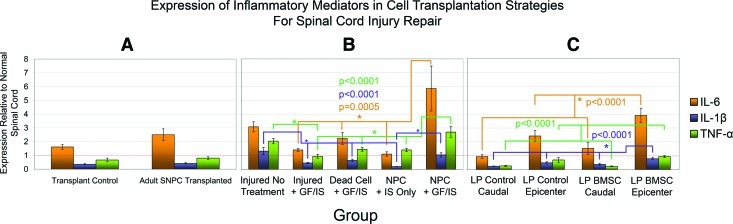
Cellular transplantation strategies for repairing the injured spinal cord have shown consistent benefit in preclinical models, and human clinical trials have begun. Interactions between transplanted cells and host tissue remain poorly understood. Trophic factor secretion is postulated a primary or supplementary mechanism of action for many transplanted cells, however, there is little direct evidence to support trophin production by transplanted cells in situ. In the present study, trophic factor expression was characterized in uninjured, injured-untreated, injured-treated with transplanted cells, and corresponding control tissue from the adult rat spinal cord. Candidate trophic factors were identified in a literature search, and primers were designed for these genes. We examined in vivo trophin expression in 3 paradigms involving transplantation of either brain or spinal cord-derived neural precursor cells (NPCs) or bone marrow stromal cells (BMSCs). Injury without further treatment led to a significant elevation of nerve growth factor (NGF), leukemia inhibitory factor (LIF), insulin-like growth factor-1 (IGF-1), and transforming growth factor-β1 (TGF-β1), and lower expression of vascular endothelial growth factor isoform A (VEGF-A) and platelet-derived growth factor-A (PDGF-A). Transplantation of NPCs led to modest changes in trophin expression, and the co-administration of intrathecal trophins resulted in significant elevation of the neurotrophins, glial-derived neurotrophic factor (GDNF), LIF, and basic fibroblast growth factor (bFGF). BMSCs transplantation upregulated NGF, LIF, and IGF-1. NPCs isolated after transplantation into the injured spinal cord expressed the neurotrophins, ciliary neurotrophic factor (CNTF), epidermal growth factor (EGF), and bFGF at higher levels than host cord. These data show that trophin expression in the spinal cord is influenced by injury and cell transplantation, particularly when combined with intrathecal trophin infusion. Trophins may contribute to the benefits associated with cell-based repair strategies for spinal cord injury.


Figures

FIG. 1.
FIG. 1.
(A) Trophin qPCR data is presented for 1 cm homogenates of the uninjured lower thoracic spinal cord. The values plotted represent average values for 3 animals, with specimens analyzed in quadruplicate for each animal. Values are presented on a logarithmic scale. All assayed trophic factors were detected. Only CNTF, PDGF, and IGF-1 are expressed at a higher level than the housekeeping gene GAPDH. (B) Trophin expression in the Injured No Treatment group (Paradigm 2) 3 weeks post-injury is plotted after normalization to the uninjured values shown in (A), denoted here by the horizontal red line. The values plotted represent average values for 3 animals, with specimens analyzed in quadruplicate for each animal. NGF, LIF, IGF-1, and TGF-β1 are significantly elevated relative to uninjured values, while PDGF and VEGF-A levels are significantly decreased. (C) In control animals from Paradigm 3, trophin expression at the epicenter was compared with a caudal control region, the latter denoted by the horizontal red line. The values plotted represent average values for 3 animals, with specimens analyzed in triplicate for each animal. NGF, PDGF, LIF, IGF-1, and TGF-β1 are significantly elevated relative to uninjured values, while GGF2 levels are significantly decreased. *denotes P<0.05. NGF, nerve growth factor; LIF, leukemia inhibitory factor; IGF-1, insulin-like growth factor-1; TGF-β1, transforming growth factor-β1; CNTF, ciliary neurotrophic factor; VEGF-A, vascular endothelial growth factor isoform A; GAPDH, glyceraldehyde 3-phosphate dehydrogenase; PDGF-A, platelet-derived growth factor-A; GGF2, glial growth factor 2; qPCR, quantitative polymerase chain reaction. Color images available online at www.liebertonline.com/scd
FIG. 2.
FIG. 2.
(A) eGFP expression was noted in all 4 adult spinal cord NPC transplanted cords from Paradigm 1. No expression was noted in the 3 control cords, indicating that primers for eGFP is specific. (B) Trophin expression levels in lower thoracic spinal cord transplanted with NPCs from 4 animals is plotted relative to control transplanted tissue from 3 animals with the latter denoted by the horizontal red line. qPCR reactions were performed in triplicate for each animal. Adult spinal cord NPC transplanted cords had significantly higher levels of CNTF and IGF-1 and significantly lower levels of BDNF and GGF2. Other differences were not significant. *denotes P<0.05. NPC, neural precursor cell; BDNF, brain-derived neurotrophic factor; eGFP, enhanced green fluorescent protein. Color images available online at www.liebertonline.com/scd
FIG. 3.
FIG. 3.
Trophin infusion and NPC transplantation is associated with a synergistic increase in trophin expression. (A) Trophin expression in cord homogenates and FACS specimens from Paradigm 2 are shown after normalization to Injured No Treatment values. (B) Data presented in (A) is re-plotted for each trophin individually. Here, horizontal red lines denote Injured No Treatment values. Analysis of variance showed significant differences for NGF (P<0.0001), BDNF (P=0.0243), NT-3 (P=0.0008), NT-4/5 (P=0.0120), GDNF (P=0.0007), EGF (P<0.0001), bFGF (P<0.0001), and LIF (P<0.0001). For NGF, post-hoc testing found that expression in the Dead Cell + GF/IS and NPC + GF/IS groups was significantly greater than that in the Injured No Treatment, Injured + GF/IS, and NPC + IS Only groups. For NT-3, GDNF, and LIF expression in the NPC + GF/IS group was significantly greater than all other groups. For BDNF and NT-4/5 expression in the NPC + GF/IS group was significantly greater than in the Injured No Treatment and Injured + GF/IS groups. For EGF and bFGF expression in the Injured No Treatment, NPC + IS Only, and NPC + GF/IS groups was significantly greater than in the Injured + GF/IS and Dead Cell + GF/IS groups. FACS expression data was analyzed separately and showed no significant differences. Sample sizes: Injured No Treatment n=3, Injured + GF/IS n=3, Dead Cell + GF/IS n=4, NPC + IS Only n=3, NPC + GF/IS n=3, FACS n=3; qPCR was performed in quadruplicate. *denotes P<0.05. NT-3, neurotrophin-3; NT-4/5, neurotrophin-4/5; bFGF, basic fibroblast growth factor; EGF, epidermal growth factor; GDNF, glial-derived neurotrophic factor; FACS, fluorescent-activated cell sorting. Color images available online at www.liebertonline.com/scd
FIG. 4.
FIG. 4.
Trophin expression and protein quantitation for VEGF-A and BDNF are concordant. Concordant RNA (left) and protein (right) quantitation is shown for VEGF (A) and BDNF (B), all analyzed 1 week post-transplant. The expression data have been re-plotted from Figure 3 with an alternate normalization to GAPDH alone. Bands used for densitometry measurements for 22 animals among the 6 experimental groups are shown in (C). Sample sizes: Uninjured qPCR 3, Western Blot n=3; Injured No Treatment qPCR n=3, Western Blot n=4; Injured + GF/IS qPCR n=3 Western Blot n=3, Dead Cell + GF/IS qPCR n=4, Western Blot n=3, NPC + IS Only qPCR n=3, Western Blot n=3, NPC + GF/IS qPCR n=3 Western Blot n=6. qPCR was performed in quadruplicate. Color images available online at www.liebertonline.com/scd
FIG. 5.
FIG. 5.
BMSC transplantation upregulates several trophins. (A) On the x-axis, the numbers denote experimental animals, while E (red) and C (blue) denote epicenter and caudal regions of spinal cords from these animals. eGFP expression was noted in 3 of 4 BMSC transplanted cords; the unsuccessfully transplanted cord was excluded from further analysis. Higher eGFP expression was found at the epicenter in all cases. No eGFP expression was noted in the 3 control transplanted cords. (B) BMSC transplanted spinal cord tissue from the epicenter (right) and caudal control region (left) is plotted relative to values from control tissue from equivalent regions with the latter denoted by the horizontal red line. (C–H) Values from (B) are re-plotted. BMSCs administered by lumbar puncture led to significantly higher levels of NGF, LIF, IGF-1, and TGF-β1 at the epicenter in comparison to those treated with saline infusion. All qPCR reactions were performed in triplicate. *denotes P<0.05. LP reflects administration of BMSCs via lumbar puncture; caudal refers to a control region of uninjured tissue caudal to the epicenter. BMSC, bone marrow stromal cell; LP, lumbar puncture. Color images available online at www.liebertonline.com/scd
FIG. 6.
FIG. 6.
Cellular transplantation upregulates inflammatory mediators. Expression of inflammatory mediators IL-6, IL-1β, and TNF-α is plotted for Paradigms 1, 2, and 3 in A, B, and C respectively. The same samples investigated in trophin studies have been employed in this analysis. In all 3 transplantation paradigms, the presence of transplanted cells led to the upregulation of the inflammatory mediators. For A and C, qPCR was performed in triplicate; for B, it was performed in quadruplicate. For C, LP reflects administration of BMSCs via lumbar puncture; caudal refers to a control region of uninjured tissue caudal to the epicenter. Sample sizes: Paradigm 1: NPC Transplanted n=4, Control n=3 Paradigm 2: Injured No Treatment n=3, Injured + GF/IS n=3, Dead Cell + GF/IS n=4, NPC + IS Only n=3, NPC + GF/IS n=3 Paradigm 3: LP Control Caudal n=3, LP Control Epicenter n=3, BMSC Control Caudal n=3, BMSC Control Epicenter n=3 *denotes P<0.05. IL-6, interleukin 6; IL-1β, interleukin 1 beta; TNF-α, tumour necrosis factor alpha. Color images available online at www.liebertonline.com/scd

References

    1. Hawryluk GW. Fehlings MG. Cellular transplantation approaches for repair of the injured spinal cord: ongoing and pending clinical trials. Top SCI Rehabil. 2009;14:47–61.
    1. Pearse DD. Pereira FC. Marcillo AE. Bates ML. Berrocal YA. Filbin MT. Bunge MB. cAMP and Schwann cells promote axonal growth and functional recovery after spinal cord injury. Nat Med. 2004;10:610–616. - PubMed
    1. Erceg S. Ronaghi M. Oria M. Rosello MG. Arago MA. Lopez MG. Radojevic I. Moreno-Manzano V. Rodriguez-Jimenez FJ, et al. Transplanted oligodendrocytes and motoneuron progenitors generated from human embryonic stem cells promote locomotor recovery after spinal cord transection. Stem Cells. 2010;28:1541–1549. - PMC - PubMed
    1. Tetzlaff W. Okon EB. Karimi-Abdolrezaee S. Hill CE. Sparling JS. Plemel JR. Plunet WT. Tsai EC. Baptiste D, et al. A systematic review of cellular transplantation therapies for spinal cord injury. J Neurotrauma. 2011;28:1611–1682. - PMC - PubMed
    1. Enzmann GU. Benton RL. Talbott JF. Cao Q. Whittemore SR. Functional considerations of stem cell transplantation therapy for spinal cord repair. J Neurotrauma. 2006;23:479–495. - PubMed

Publication types

MeSH terms

Substances