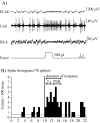
Amygdala-prefrontal pathways and the dopamine system affect nociceptive responses in the prefrontal cortex
- PMID: 22085449
- PMCID: PMC3228703
- DOI: 10.1186/1471-2202-12-115
Amygdala-prefrontal pathways and the dopamine system affect nociceptive responses in the prefrontal cortex
Abstract
Background: We previously demonstrated nociceptive discharges to be evoked by mechanical noxious stimulation in the prefrontal cortex (PFC). The nociceptive responses recorded in the PFC are conceivably involved in the affective rather than the sensory-discriminative dimension of pain. The PFC receives dense projection from the limbic system. Monosynaptic projections from the basolateral nucleus of the amygdala (BLA) to the PFC are known to produce long-lasting synaptic plasticity. We examined effects of high frequency stimulation (HFS) delivered to the BLA on nociceptive responses in the rat PFC.
Results: HFS induced long lasting suppression (LLS) of the specific high threshold responses of nociceptive neurons in the PFC. Microinjection of N-methyl-D-aspartic acid (NMDA) receptor antagonists (2-amino-5-phosphonovaleric acid (APV), dizocilpine (MK-801)) and also metabotropic glutamate receptor (mGluR) group antagonists (α-methyl-4-carboxyphenylglycine (MCPG), and 2-[(1S,2S)-2-carboxycyclopropyl]-3-(9H-xanthen-9-yl)-D-alanine (LY341495)), prevented the induction of LLS of nociceptive responses. We also examined modulatory effects of dopamine (DA) on the LLS of nociceptive responses. With depletion of DA in response to 6-hydroxydopamine (6-OHDA) injection into the ipsilateral forebrain bundle, LLS of nociceptive responses was decreased, while nociceptive responses were normally evoked. Antagonists of DA receptor subtypes D2 (sulpiride) and D4 (3-{[4-(4-chlorophenyl) piperazin-1-yl] methyl}-1H-pyrrolo [2, 3-b] pyridine (L-745,870)), microinjected into the PFC, inhibited LLS of nociceptive responses.
Conclusions: Our results indicate that BLA-PFC pathways inhibited PFC nociceptive cell activities and that the DA system modifies the BLA-PFC regulatory function.
Figures


Similar articles
-
Mesocortical dopamine system modulates mechanical nociceptive responses recorded in the rat prefrontal cortex.BMC Neurosci. 2013 Jul 2;14:65. doi: 10.1186/1471-2202-14-65. BMC Neurosci. 2013. PMID: 23815681 Free PMC article.
-
Hippocampal CA1/subiculum-prefrontal cortical pathways induce plastic changes of nociceptive responses in cingulate and prelimbic areas.BMC Neurosci. 2010 Aug 17;11:100. doi: 10.1186/1471-2202-11-100. BMC Neurosci. 2010. PMID: 20716327 Free PMC article.
-
Dopaminergic regulation of inhibitory and excitatory transmission in the basolateral amygdala-prefrontal cortical pathway.J Neurosci. 2007 Feb 21;27(8):2045-57. doi: 10.1523/JNEUROSCI.5474-06.2007. J Neurosci. 2007. PMID: 17314300 Free PMC article.
-
Regulation of conditioned responses of basolateral amygdala neurons.Physiol Behav. 2002 Dec;77(4-5):489-93. doi: 10.1016/s0031-9384(02)00909-5. Physiol Behav. 2002. PMID: 12526988 Review.
-
Neurotransmitters and prefrontal cortex-limbic system interactions: implications for plasticity and psychiatric disorders.J Neural Transm (Vienna). 2009 Aug;116(8):941-52. doi: 10.1007/s00702-009-0243-8. Epub 2009 May 28. J Neural Transm (Vienna). 2009. PMID: 19475335 Review.
Cited by
-
Disentangling depression and distress networks in the tinnitus brain.PLoS One. 2012;7(7):e40544. doi: 10.1371/journal.pone.0040544. Epub 2012 Jul 12. PLoS One. 2012. PMID: 22808188 Free PMC article.
-
Mesocortical dopamine system modulates mechanical nociceptive responses recorded in the rat prefrontal cortex.BMC Neurosci. 2013 Jul 2;14:65. doi: 10.1186/1471-2202-14-65. BMC Neurosci. 2013. PMID: 23815681 Free PMC article.
-
Calcium-permeable AMPA receptors in the nucleus accumbens regulate depression-like behaviors in the chronic neuropathic pain state.J Neurosci. 2013 Nov 27;33(48):19034-44. doi: 10.1523/JNEUROSCI.2454-13.2013. J Neurosci. 2013. PMID: 24285907 Free PMC article.
-
Pain relief associated with decreased oxyhemoglobin level in left dorsolateral prefrontal cortex.PLoS One. 2021 Aug 23;16(8):e0256626. doi: 10.1371/journal.pone.0256626. eCollection 2021. PLoS One. 2021. PMID: 34424921 Free PMC article.
-
Group II mGluRs modulate baseline and arthritis pain-related synaptic transmission in the rat medial prefrontal cortex.Neuropharmacology. 2015 Aug;95:388-94. doi: 10.1016/j.neuropharm.2015.04.003. Epub 2015 Apr 22. Neuropharmacology. 2015. PMID: 25912637 Free PMC article.
References
-
- Bantick SJ, Wise RG, Ploghaus A, Clare S, Smith SM, Tracey I. Imaging how attention modulates pain in humans using functional MRI. Brain. 2002;125(Pt 2):310–319. - PubMed
-
- Rainville P, Duncan G, Price D, Carrier B, Bushnell M. Pain affect encoded in human anterior cingulate but not somatosensory cortex. Science. 1997;277(5328):968–971. - PubMed
-
- Lapo IB, Konarzewski M, Sadowski B. Analgesia induced by swim stress: interaction between analgesic and thermoregulatory mechanisms. Pflugers Archiv-European Journal of Physiology. 2003;446(4):463–469. - PubMed
-
- Sawamoto N, Honda M, Okada T, Hanakawa T, Kanda M, Fukuyama H, Konishi J, Shibasaki H. Expectation of pain enhances responses to nonpainful somatosensory stimulation in the anterior cingulate cortex and parietal operculum/posterior insula: an event-related functional magnetic resonance imaging study. J Neurosci. 2000;20(19):7438–7445. - PMC - PubMed
-
- Sikes RW, Vogt BA. Nociceptive neurons in area 24 of rabbit cingulate cortex. J Neurophysiol. 1992;68(5):1720–1732. - PubMed
Publication types
MeSH terms
Substances
LinkOut - more resources
Full Text Sources
Miscellaneous

