. 2012 Jan;283(1-2):98-106.
doi: 10.1016/j.heares.2011.10.008. Epub 2011 Nov 7.

Acoustic over-exposure triggers burst firing in dorsal cochlear nucleus fusiform cells

Affiliations

Acoustic over-exposure triggers burst firing in dorsal cochlear nucleus fusiform cells

Nadia Pilati et al. Hear Res. 2012 Jan.

Abstract

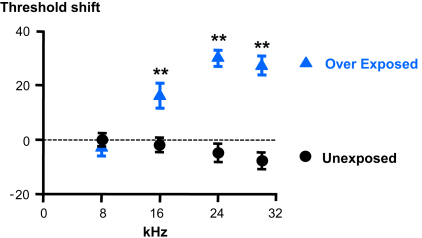
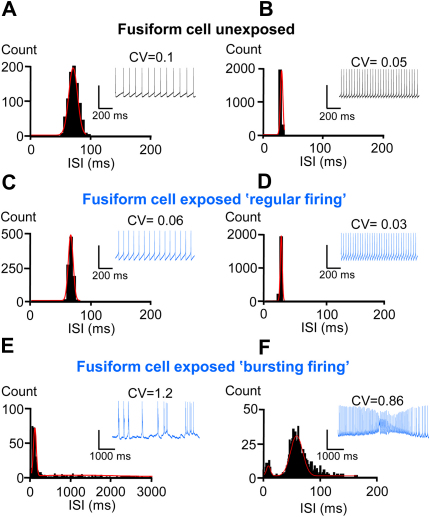
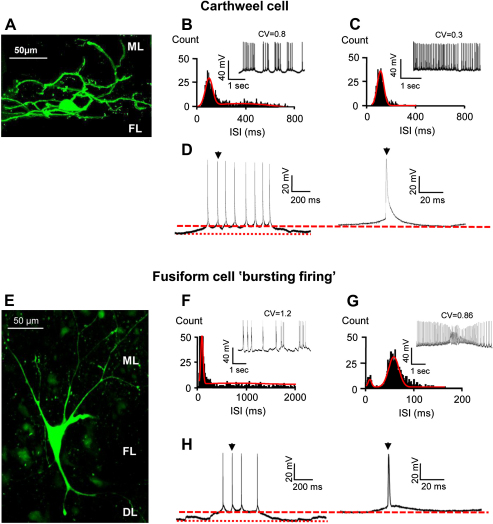
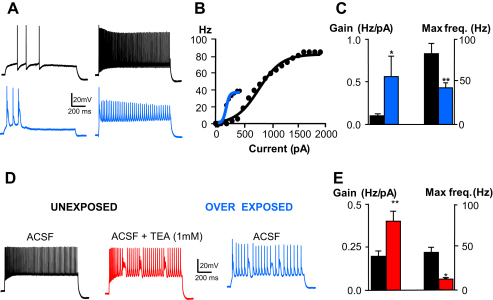
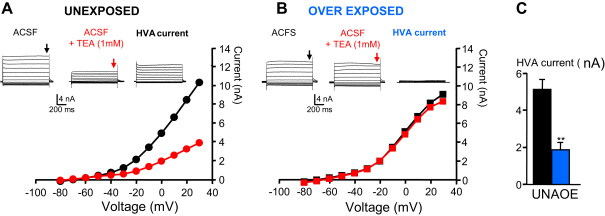
Acoustic over-exposure (AOE) triggers deafness in animals and humans and provokes auditory nerve degeneration. Weeks after exposure there is an increase in the cellular excitability within the dorsal cochlear nucleus (DCN) and this is considered as a possible neural correlate of tinnitus. The origin of this DCN hyperactivity phenomenon is still unknown but it is associated with neurons lying within the fusiform cell layer. Here we investigated changes of excitability within identified fusiform cells following AOE. Wistar rats were exposed to a loud (110 dB SPL) single tone (14.8 kHz) for 4 h. Auditory brainstem response recordings performed 3-4 days after AOE showed that the hearing thresholds were significantly elevated by about 20-30 dB SPL for frequencies above 15 kHz. Control fusiform cells fired with a regular firing pattern as assessed by the coefficient of variation of the inter-spike interval distribution of 0.19 ± 0.11 (n = 5). Three to four days after AOE, 40% of fusiform cells exhibited irregular bursting discharge patterns (coefficient of variation of the inter-spike interval distribution of 1.8 ± 0.6, n = 5; p < 0.05). Additionally the maximal firing following step current injections was reduced in these cells (from 83 ± 11 Hz, n = 5 in unexposed condition to 43 ± 6 Hz, n = 5 after AOE) and this was accompanied by an increased firing gain (from 0.09 ± 0.01 Hz/pA, n = 5 in unexposed condition to 0.56 ± 0.25 Hz/pA, n = 5 after AOE). Current and voltage clamp recordings suggest that the presence of bursts in fusiform cells is related to a down regulation of high voltage activated potassium currents. In conclusion we showed that AOE triggers deafness at early stages and this is correlated with profound changes in the firing pattern and frequency of the DCN major output fusiform cells. The changes here described could represent the initial network imbalance prior to the emergence of tinnitus.


Figures

Fig. 1
Fig. 1
Exposure to a 14.8 kHz tone (110 dB SPL) increases the hearing threshold for frequencies exceeding 8 kHz. Wistar rats (P15-17) were either exposed at day 0 or similarly anesthetized but unexposed to the single tone. Summary of auditory brainstem response thresholds shifts (see Methods) for 8–30 kHz frequencies from 13 unexposed and 20 exposed rats. **P < 0.01, unpaired t student test.
Fig. 2
Fig. 2
Acoustic over-exposure triggers an irregular spontaneous firing pattern in a proportion of DCN fusiform cells (FCs). Histograms show the inter-spike interval (ISI) distributions (from unexposed and exposed rats) with corresponding traces in inset as FCs are firing at threshold (A, C, E) and at their maximal firing frequency (B, D, F) when depolarized. Above each trace the coefficient of variation (CV) relative to the distribution is shown. A, B. A regular firing pattern is observed in a FC from an unexposed rat with ISI distributions fitted with a Gaussian function. C, D. Example of a FC firing with a regular pattern after AOE with ISI distributions fitted with a Gaussian function. E, F. Example of a FC firing with bursts after AOE with ISI distributions fitted with a double Gaussian function. Similar pattern was observed in 6/22 FCs after AOE. Holding potentials were −62 mV (A), −55 mV (B), −61 mV (C), −56 mV (D), −68 mV (E), −58 mV (F); maximal firing frequencies were 30 Hz (B), 32 Hz (D), 20 Hz (F); ISI at the peak were 86 ms (A), 33 ms (B), 65 ms (C), 33 ms (D), 34 and 1100 ms (E), 10 and 90 ms (F). Vertical calibration bars: 40 mV.
Fig. 3
Fig. 3
Example of a cartwheel cell (A–D) and a fusiform cell (E–H) firing with bursts after AOE. A. Cartwheel cell filled with lucifer yellow lying between the fusiform layer (FL) and the molecular layer (ML) characterised by its large spiny dendritic tree. B–D. Cartwheel cell firing with bursts in control conditions with ISI distributions fitted with a double (B) or a single (C) Gaussian function. Example of a burst of action potentials recorded in this cartwheel cell and a single action potential within the burst (D, arrowhead). E. Fusiform cell filled with lucifer yellow lying in the FL characterised by its fusiform shape. Its basal dendrites project towards the deep layer (DL) while the apical dendrites are orientated towards the ML. F–H. Fusiform cell firing with bursts after acoustic over-exposure with ISI distributions fitted with a double Gaussian function (F, G). Example of a burst of action potentials recorded in this fusiform cell and a single action potential within the burst (H, arrowhead). The dashed lines in D and H represent the baseline from which measurements for the action potential were taken whereas the dotted lines represent the baseline of the burst. Membrane potentials were −67 mV (B), −63 mV (C), −68 mV (F), −58 mV (G); maximal firing frequencies were 24 Hz (C), 20 Hz (G); ISI at the peaks were 98 and 400 ms (B) 117 ms (C) 34 and 1100 ms (F), 10 and 90 ms (G). Above each trace the coefficient of variation (CV) relative to the distribution is shown.
Fig. 4
Fig. 4
Effects of AOE on FC transfer function are reproduced by blocking high voltage activated (HVA) K+ currents. A–C. AOE decreases the maximal firing frequency in FCs. Traces in A represent the FC firing at maximal frequency in response to 1 s step current injection in unexposed (black) and over-exposed condition (blue). (B) FC transfer function for the same cells shown in A, B. Gains were 0.05 Hz/pA (unexposed) and 0.2 Hz/pA (exposed), maximal frequencies were 84 Hz (unexposed), 40 Hz (exposed). C. Summary histograms representing the firing gain and the maximal firing frequencies for unexposed (n = 5, black) and exposed conditions (n = 5, blue). **P < 0.01, *P < 0.05 (unpaired t test). D. TEA (1 mM) triggers bursts in FCs similarly to AOE. E. Summary histograms representing the firing gain and the maximal firing frequencies for FCs recorded in ACSF (black) and following application of TEA (red) (n = 3, *P < 0.05, **P < 0.01 paired T tests). Membrane potentials were −80 mV. (For interpretation of the references to colour in this figure legend, the reader is referred to the web version of this article.)
Fig. 5
Fig. 5
HVA K+ currents are down regulated after AOE. Representative current traces and current–voltage relationship for HVA K+ currents in unexposed (A) and exposed (B) conditions in absence (ACSF) and in presence of TEA (ACSF + TEA 1 mM). The HVA K+ currents were obtained by subtracting the current recorded in the presence of TEA from the current measured in ACSF C. Summary histograms representing the HVA K+ current measured at +30 mV in unexposed (black) and exposed (blue) condition **P < 0.01, unpaired t test. (For interpretation of the references to colour in this figure legend, the reader is referred to the web version of this article.)

Similar articles

Cited by

References

    1. Barnes-Davies M., Barker M.C., Osmani F., Forsythe I.D. Kv1 currents mediate a gradient of principal neuron excitability across the tonotopic axis in the rat lateral superior olive. Eur. J. Neurosci. 2004;19:325–333. - PubMed
    1. Barrs D.M., Brackmann D.E., Hitselberger W.E. Facial nerve anastomosis in the cerebellopontine angle: a review of 24 cases. Am. J. Otol. 1984;5:269–272. - PubMed
    1. Brew H., Forsythe I. Two voltage-dependent K+ conductances with complementary functions in postsynaptic integration at a central auditory synapse. J. Neurosci. 1995;15:8011–8022. - PMC - PubMed
    1. Brozoski T.J., Bauer C.A., Caspary D.M. Elevated Fusiform cell activity in the dorsal cochlear nucleus of chinchillas with psychophysical evidence of tinnitus. J. Neurosci. 2002;22:2383–2390. - PMC - PubMed
    1. Buzsaki G., Csicsvari J., Dragoi G., Harris K., Henze D., Hirase H. Homeostatic maintenance of neuronal excitability by burst discharges in vivo. Cereb. Cortex. 2002;12:893–899. - PubMed

Publication types

MeSH terms

Substances