. 2011 Nov 15:12:447.
doi: 10.1186/1471-2105-12-447.

OmniMapFree: a unified tool to visualise and explore sequenced genomes

Affiliations

OmniMapFree: a unified tool to visualise and explore sequenced genomes

John Antoniw et al. BMC Bioinformatics. .

Abstract

Background: Acquiring and exploring whole genome sequence information for a species under investigation is now a routine experimental approach. On most genome browsers, typically, only the DNA sequence, EST support, motif search results, and GO annotations are displayed. However, for many species, a growing volume of additional experimental information is available but this is rarely searchable within the landscape of the entire genome. •

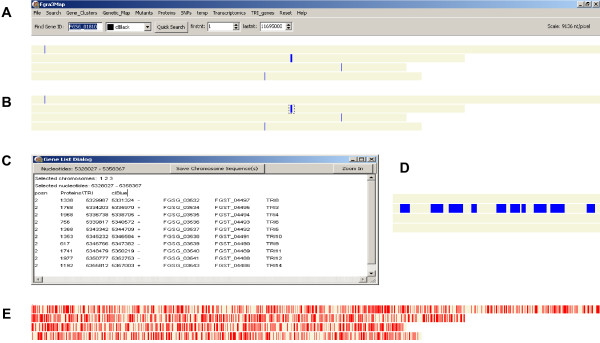
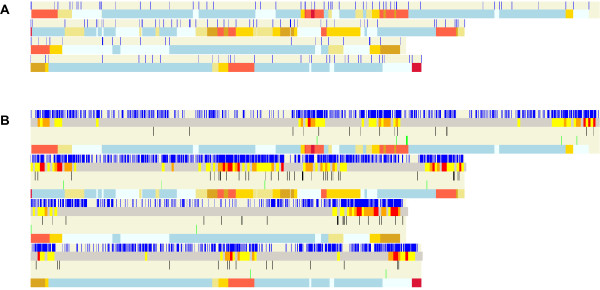
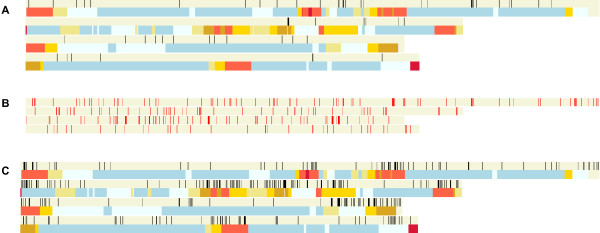
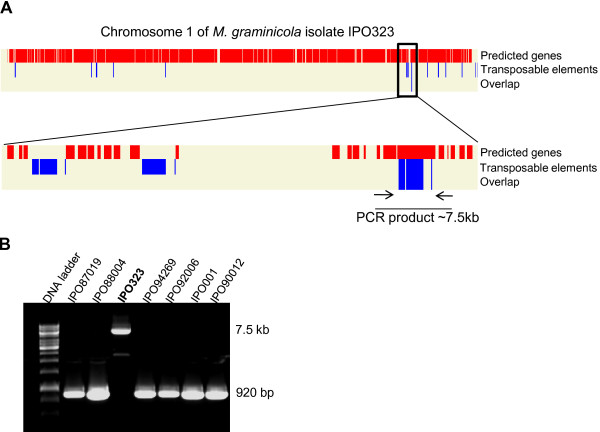
Results: We have developed a generic software which permits users to view a single genome in entirety either within its chromosome or supercontig context within a single window. This software permits the genome to be displayed at any scales and with any features. Different data types and data sets are displayed onto the genome, which have been acquired from other types of studies including classical genetics, forward and reverse genetics, transcriptomics, proteomics and improved annotation from alternative sources. In each display, different types of information can be overlapped, then retrieved in the desired combinations and scales and used in follow up analyses. The displays generated are of publication quality. •

Conclusions: OmniMapFree provides a unified, versatile and easy-to-use software tool for studying a single genome in association with all the other datasets and data types available for the organism.


Figures

Figure 1
Figure 1
Screenshots of OmniMap displaying the four Fusarium graminearum chromosomes and gene information. (a) TRI genes displayed by selecting the TRI_genes menu from the top menu bar. The four chromosomes are drawn to scale in grey and the genes are displayed in blue. The species specific OmniMap name, Fgra3Map, is displayed top left. The other menu features shown are described in the main text and Table 1. (b) Selection of the main cluster of TRI genes in the middle of chromosome 2 using the mouse. The selected region is shown as a dashed rectangle. (c) This shows the text data for the TRI gene cluster selected in panel b. The third line of the text window: posn TRI_genes\TRI_genes clBlue indicates the data file was of type "posn", its path relative to Fgra3Map.exe was "\TRi_genes\TRI_genes.posn" and the genes are displayed in blue. The following 10 lines give information about each gene. The columns from left to right cover chromosome id, gene length (nt), first nt of gene, last nt of gene, the coding DNA strand, gene id (assigned by BROAD) and the gene annotation [7]. (d) A 'zoomed in' display of the chromosome region selected in panel (b), revealing the presence of the 10 TRI genes (blue boxes). (e) Genome wide distribution of the 2,002 F. graminearum genes which are considered to be species specific (BLAST E-value cut-off: e-10). The data files were produced from the Fusarium graminearum Genome Database (FGDB) at the Munich Information Centre for Proteins Sequences (MIPS) version FG3.
Figure 2
Figure 2
Screenshots of Fgra3Map linking Fusarium graminearum gene information to the genetic map. (a) The position of each molecular marker is shown in blue on each of the four chromosomes. The corresponding frequency of recombination is shown below the marker display for each chromosome using a colour gradient described in the first #-line of the .freq data file i.e. # clBeige 1 clKhaki 2 clGold 3 clGoldenRod 4 clTomato 8 clCrimson. The numbers between the colours are boundary values in cM/27 kb-so beige represents the lowest and crimson the highest recombination frequency. This information was retrieved from [23]. (b) The distribution of SNPs in the Fusarium graminearum genome compared with genetic recombination frequency and genes coding for putative cell wall degrading enzymes. There are 5 rows shown for each chromosome and each chromosome is separated from the next by a thin, horizontal white line. For each chromosome the top row shows the SNPs as thin, vertical blue lines. This information was retrieved from [23]. The second row shows the SNP density, the third row shows the genes coding for putative cell wall degrading enzymes coloured black, the fourth row shows the genes coding for polyketide synthases and the fifth row shows the genetic recombination frequency (as in Figure 2a).
Figure 3
Figure 3
Screenshots of Fgra3Map linking verified Fusarium graminearum gene function information, to gene function predictions and to gene expression information. (a) The distribution of experimentally verified Fusarium graminearum pathogenicity and virulence genes. Each gene is displayed in black on the chromosomes. As of April 2011, 61 genes have been published (PHI-base 3.2 and Additional file 2). The second row shows the genetic recombination frequencies. (b) The distribution of homologues of pathogenicity and virulence genes revealed through experimentation in a range of plant and animal pathogenic species (PHI-base version 2.1 [44]). The F. graminearum homologues were found by BLASTP search using an E-value cut-off of e-100. The location of each gene homologue is shown in red on the chromosomes. (c) Fusarium graminearum genes expressed specifically in planta (barley) displayed using the Transcriptomics/Barley in planta menu. The genes are displayed in red on the chromosomes. Data sources: see [45] and Plexdb [46] for Fusarium experiments FG1 and FG2.
Figure 4
Figure 4
Screenshot of OmniMap analysis on the presence of transposable elements within open reading frames on chromosome 1 of the Mycosphaerella graminicola genome. The specific map developed for this organism is called MgraMap and was created using the whole genome downloads available from the JGI (Version 2). (a) Top bar shows the position of all predicted genes (in red vertical bars). Middle bar shows the position of one transposable element which is identified many times throughout the entire genome sequence (in blue vertical bars). Bottom bar highlights the position of 1 ORF (Gene model Id = e_gw1.1.932.1) which has been disrupted through the integration of the transposon (shown in close-up below with the position of analytical PCR primers). (b) Follow up PCR on genomic DNA from seven M. graminicola isolates. This analysis confirmed that the open reading frame (ORF) interrupted by transposon insertion in isolate IPO323 was intact (insertion free) in the other six isolates tested. This represents an example where OmniMap can be used to highlight genomic regions which could be the source of genetic variation between individuals of a species.

References

    1. Goffeau A, Barrell BG, Bussey H, Davis RW, Dujon B, Feldmann H, Galibert F, Hoheisel JD, Jacq C, Johnston M. et al.Life with 6000 Genes. Science. 1996;274:546–566. doi: 10.1126/science.274.5287.546. - DOI - PubMed
    1. Saccharomyces Genome Database. http://www.yeastgenome.org/ http://www.yeastgenome.org/
    1. Yeast Gene Order Browser. http://wolfe.gen.tcd.ie/ygob/ http://wolfe.gen.tcd.ie/ygob/
    1. Birren B, Fink GR, Lander E. Fungal genome initiative. White Paper developed by the Fungal Research Community. 2003.
    1. GOLD Genomes OnLine Database. http://www.genomesonline.org http://www.genomesonline.org

Publication types