. 2011 Dec 1;25(23):2453-64.
doi: 10.1101/gad.176008.111. Epub 2011 Nov 15.

Sequentially acting Sox transcription factors in neural lineage development

Affiliations

Sequentially acting Sox transcription factors in neural lineage development

Maria Bergsland et al. Genes Dev. .

Abstract

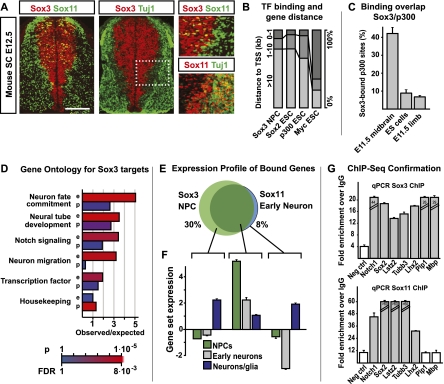
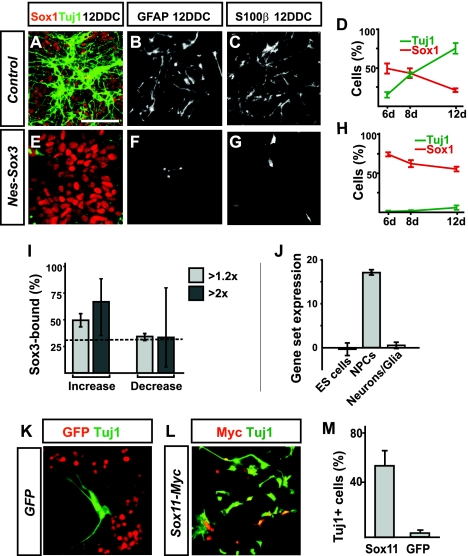
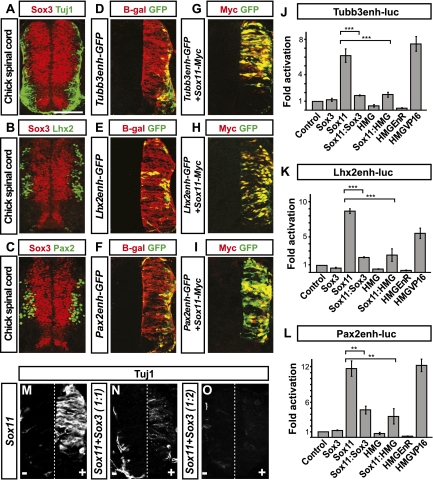
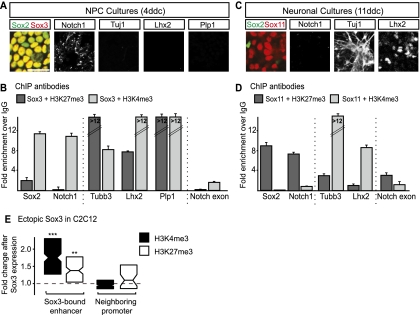
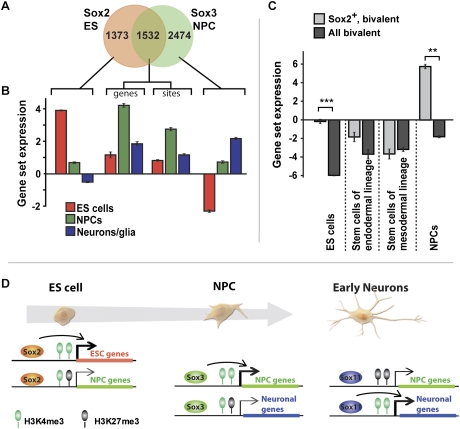
Pluripotent embryonic stem (ES) cells can generate all cell types, but how cell lineages are initially specified and maintained during development remains largely unknown. Different classes of Sox transcription factors are expressed during neurogenesis and have been assigned important roles from early lineage specification to neuronal differentiation. Here we characterize the genome-wide binding for Sox2, Sox3, and Sox11, which have vital functions in ES cells, neural precursor cells (NPCs), and maturing neurons, respectively. The data demonstrate that Sox factor binding depends on developmental stage-specific constraints and reveal a remarkable sequential binding of Sox proteins to a common set of neural genes. Interestingly, in ES cells, Sox2 preselects for neural lineage-specific genes destined to be bound and activated by Sox3 in NPCs. In NPCs, Sox3 binds genes that are later bound and activated by Sox11 in differentiating neurons. Genes prebound by Sox proteins are associated with a bivalent chromatin signature, which is resolved into a permissive monovalent state upon binding of activating Sox factors. These data indicate that a single key transcription factor family acts sequentially to coordinate neural gene expression from the early lineage specification in pluripotent cells to later stages of neuronal development.


Figures

Figure 1.
Figure 1.
Genome-wide binding maps of Sox factors in neural development. (A) Expression of Sox3, Sox11, and the neuronal protein Tuj1 in developing mouse spinal cord. Bars: A, 100 μm; 40 μm. (B) Localization of genome-wide Sox3 binding relative to annotated TSSs. Percentages of sites located within 1 kb, 1–10 kb, and >10 kb from a TSS are shown for Sox3 in NPCs, as well as Sox2, p300, and Myc in ES cells. (C) Percentage overlap between Sox3 NPC peaks and p300 peaks in mouse embryonic (embryonic day 11.5 [E11.5]) brain, limb, and ES cells. Bound regions were considered overlapping if the distance between peak centers was <300 base pairs (bp). (D) Genes with Sox3 binding within enhancer regions (e) were enriched for developmentally significant functions, whereas genes with Sox3 binding in promoter regions (p) were enriched for housekeeping functions. (E) Venn diagram showing the overlap in target sites between Sox3 in NPCs and Sox11 in early-formed neurons. (F) Gene set expression for Sox3-specific genes, Sox11-specific genes, and genes bound by both Sox3 and Sox11 in E using microarray data of NPCs, PSA-NCAM1+ early neurons, and adult neurons and glia. (G) Confirmation of Sox3 and Sox11 ChIP-seq peaks using ChIP-qPCR analysis. White bars indicate nonbound regions from ChIP-seq experiments. Error bars correspond to standard deviation of three qPCR replicates. Bars >60 indicate fold enrichment over an undetectable IgG signal after 50 cycles of PCR.
Figure 2.
Figure 2.
Function of Sox factors in neurogenesis. (A–C) Expression of the neural progenitor marker Sox1, the pan-neuronal marker Tuj1, and the astrocytic markers GFAP and S100β in ES cell-derived differentiating neurons and glia after 12 d in differentiation conditions (DDC). (D) The fraction of NPCs that expresses Sox1 or up-regulated Tuj1 after 6, 8, and 12 DDC. (E–G) Expression of Sox1, Tuj1, GFAP, and S100β in Sox3 overexpressing ES cell-derived NPCs (Nes-Sox3) after 12 DDC. (H) The fraction of Nes-Sox3 NPCs expressing Sox1 and Tuj1 after 6, 8, and 12 DDC. (I) Percent of up-regulated and down-regulated genes (identified by Sox3 overexpression microarray experiment at fold change levels 2 and 1.2) that are bound by Sox3 (ChIP-seq experiment). Error bars represent 95% confidence intervals. The dashed line denotes the expected fraction of Sox3 binding. (J) Gene set expression profile of genes that were both bound by Sox3 and up-regulated in the Sox3-overexpressing NPCs. Error bars indicate standard error of the mean. (K–M) Sox11-misexpressing NPCs show Tuj1 expression in 52% of the transfected cells at 20 h post-transfection (L,M) compared with <5% of GFP transfected NPCs (K,M). Bars: A–C,E–G, 20 μm; K,L, 40μm.
Figure 3.
Figure 3.
Competitive Sox binding at neuronal genes. (A–C) Expression of Sox3 and the neuronal proteins Tuj1 (A), Lhx2 (B), and Pax2 (C) in developing chick spinal cord. (D–F) Sox3- and Sox11-bound enhancers of the neuronal genes Tubb3 (D), Lhx2 (E), and Pax2 (F) can drive the expression of a GFP reporter in post-mitotic neurons of the electroporated chick spinal cord. Chick embryos were electroporated at HH stages 9–11 and harvested after 45 h of incubation. β-Galoctosidase represents electroporation control. (G–I) Cotransfection of a Sox11-Myc expression vector broadly activated all GFP reporters in D–F throughout the electroporated neural tube. Chick embryos were electroporated at HH stages 10–12 and harvested after 24 h of incubation. (J–L) Transactivation assays in P19 cells with Tubb3-luc (J), Lhx2-luc (K), or Pax2-luc (L) reporter constructs in the presence of vectors expressing Sox11, Sox3, or the HMG domain of Sox3 either alone or fused to the EnR repression domain or VP16 activation domain. Results are represented as mean ± SEM from three to nine experiments. (**) P < 0.01; (***) P < 0.001. (M–O) Tuj1 expression in chick spinal cord 24 h after electroporation (at HH stages 9–11) with Sox11 alone (M) or together with Sox3 at a ratio of 1:1 (N) or 1:2 (O). A plus sign (+) denotes the electroporated side of the spinal cord and a minus sign (−) denotes the control side. Bars: A–I, 50 μm; M–O, 40 μm.
Figure 4.
Figure 4.
Active histone modifications associated with Sox3 binding. (A) Expression of NPC proteins (Sox2 and Notch1), neuronal proteins (Tuj1 and Lhx2), and the glial protein Plp1 in Sox3-expressing ES cell-derived NPCs (4 DDC). (B) Histone modifications of Sox3 targeted genes were measured by sequential ChIP experiments. Chromatin precipitation of Sox3-bound regions in NPCs (4 DDC, shown in A) were followed by H3K4me3- or H3K27me3-specific chromatin precipitations and qPCR analysis. (C) Expression of NPC proteins (Sox2 and Notch1) and neuronal proteins (Tuj1 and Lhx2) in Sox11-expressing ES cell-derived neurons (11 DDC). (D) Histone modifications of Sox11 targeted genes were measured by sequential ChIP experiments. Chromatin precipitation of Sox11-bound regions in neurons (11 DDC, shown in C) was followed by H3K4me3- or H3K27me3-specific chromatin precipitations and qPCR analysis. As the Plp1 gene is not bound by Sox11, it was excluded from this analysis. Error bars represent the standard deviation of triplicate qPCR measurements from one representative ChIP experiment out of three. Samples denoted with >12-fold change had no detectable IgG signal after 50 cycles of PCR. Bars: A,C, 15 μm. (E) Fold change in histone modifications in C2C12 cells, shown as box plots, at all enhancers bound by ectopic Sox3 or at their neighboring promoters. Asterisks indicate positive correlation between fold change in methylation and Sox3-binding strength ([**] P < 0.01; [***] P < 0.001), giving further support of direct effects.
Figure 5.
Figure 5.
Bivalent NPC genes prebound by Sox2 in ES cells. (A) Venn diagram showing the overlap in number of target genes between Sox2 in ES cells and Sox3 in NPCs. (B) Expression profile for genes bound by Sox2 in ES cells and Sox3 in NPCs, as shown in A. Gene set expression in ES cells, NPCs, and neurons/glia is presented as percentile rank above average, with error bars showing standard error of the mean among replicates. Overlap in Sox binding at both the level of genes and further separated into those genes bound by Sox2 and Sox3 at the same site (56%–58% of genes). (C) Gene set expression in stem and progenitor cells of different origins for genes with Sox2 binding close (<5 kb) to bivalent domains containing both H3K4me3 and H3K27me3 marks in ES cells. All genes with bivalent marks are shown as a control. Significant differences (paired t-test) are indicated. (**) P < 0.01 or (***) P < 0.001. (D) Model depicting the sequential binding of Sox proteins to common downstream genes in stem cells differentiation along the neural lineage, highlighting the association between Sox prebinding and bivalent histone modifications.

Comment in

References

    1. Altschul SF, Erickson BW 1985. Significance of nucleotide sequence alignments: A method for random sequence permutation that preserves dinucleotide and codon usage. Mol Biol Evol 2: 526–538 - PubMed
    1. Andersson E, Tryggvason U, Deng Q, Friling S, Alekseenko Z, Robert B, Perlmann T, Ericson J 2006. Identification of intrinsic determinants of midbrain dopamine neurons. Cell 124: 393–405 - PubMed
    1. Avilion AA, Nicolis SK, Pevny LH, Perez L, Vivian N, Lovell-Badge R 2003. Multipotent cell lineages in early mouse development depend on SOX2 function. Genes Dev 17: 126–140 - PMC - PubMed
    1. Badis G, Berger MF, Philippakis AA, Talukder S, Gehrke AR, Jaeger SA, Chan ET, Metzler G, Vedenko A, Chen X, et al. 2009. Diversity and complexity in DNA recognition by transcription factors. Science 324: 1720–1723 - PMC - PubMed
    1. Bailey TL, Elkan C 1994. Fitting a mixture model by expectation maximization to discover motifs in biopolymers. Proc Int Conf Intell Syst Mol Biol 2: 28–36 - PubMed

Publication types