. 2012 Feb 1;31(3):679-91.
doi: 10.1038/emboj.2011.417. Epub 2011 Nov 15.

Optimal functional levels of activation-induced deaminase specifically require the Hsp40 DnaJa1

Affiliations

Optimal functional levels of activation-induced deaminase specifically require the Hsp40 DnaJa1

Alexandre Orthwein et al. EMBO J. .

Abstract

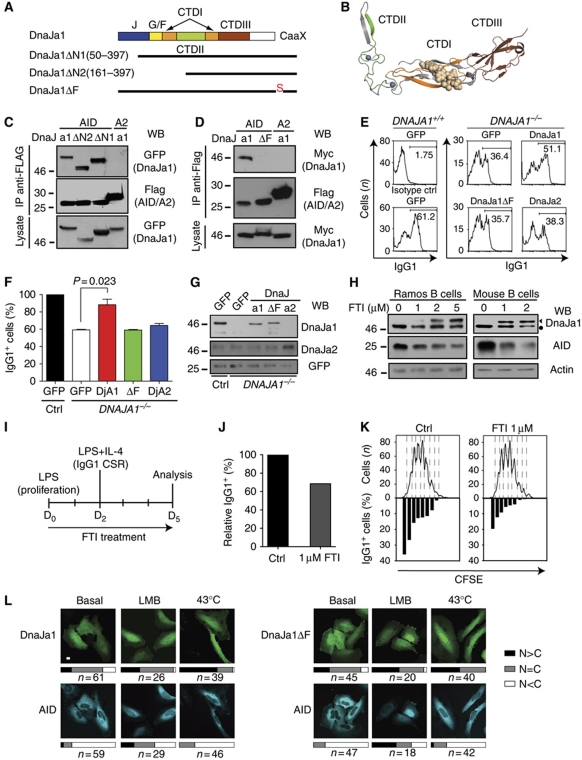
The enzyme activation-induced deaminase (AID) deaminates deoxycytidine at the immunoglobulin genes, thereby initiating antibody affinity maturation and isotype class switching during immune responses. In contrast, off-target DNA damage caused by AID is oncogenic. Central to balancing immunity and cancer is AID regulation, including the mechanisms determining AID protein levels. We describe a specific functional interaction between AID and the Hsp40 DnaJa1, which provides insight into the function of both proteins. Although both major cytoplasmic type I Hsp40s, DnaJa1 and DnaJa2, are induced upon B-cell activation and interact with AID in vitro, only DnaJa1 overexpression increases AID levels and biological activity in cell lines. Conversely, DnaJa1, but not DnaJa2, depletion reduces AID levels, stability and isotype switching. In vivo, DnaJa1-deficient mice display compromised response to immunization, AID protein and isotype switching levels being reduced by half. Moreover, DnaJa1 farnesylation is required to maintain, and farnesyltransferase inhibition reduces, AID protein levels in B cells. Thus, DnaJa1 is a limiting factor that plays a non-redundant role in the functional stabilization of AID.


Conflict of interest statement

The authors declare that they have no conflict of interest.

Figures

Figure 1
Figure 1
AID interacts with type I J-proteins. (A) Yeast two-hybrid assay showing the interaction of AID with DnaJa2 (truncated clone starting at codon 198). The AID-interacting protein CTNNLB1, isolated in the same screening from a human spleen library (Conticello et al, 2008), was used as positive control. GAL, galactose; GLU, glucose; MET, methionine. (B) AID–Flag/HA was sequentially immunoprecipitated using anti-Flag and then anti-HA from extracts of stably expressing Ramos cells and analysed by western blot after each step to detect endogenous DnaJa1. One of the two independent experiments is shown. (C) GFP or AID–GFP were immunoprecipitated from extracts of stably expressing Ramos cells and analysed as in (B). (D) Schematic structure of type I (DjA) and type II (DjB) J-proteins. Similarity values (%) for each structural domain, calculated from the alignment between DnaJa1 and DnaJb1, are indicated. (E) Lysates from HEK293T cells cotransfected with Flag-tagged AID or APOBEC2 (A2) and Myc-tagged versions of the indicated DnaJ proteins were immunoprecipitated with anti-Flag and analysed by western blot. One of the two independent experiments is shown. (F) Expression of selected DnaJ proteins in total cell lysates of mouse naive primary splenic B cells purified by CD43 depletion (>97% CD43 B220+) either resting (0) or after 1–3 days stimulation with IL-4 and LPS, analysed by western blot using antibodies against DnaJa1, DnaJa2, DnaJa4, DnaJb1 and actin. The CD43-enriched fraction (a heterogeneous mixture including T, B and other leukocytes) was included as an additional control. Exposure times vary between panels and do not accurately reflect relative abundances. (G) AID–GFP or AID–Flag/HA were immunoprecipitated in the presence of 1 mg/ml DNase and/or 0.5 mg/ml RNase using the corresponding anti-tag antibodies from lysates of HEK293T cell contransfected with Flag–DnaJa1 or Myc–DnaJa2, respectively, and analysed by western blot.
Figure 2
Figure 2
AID but not the APOBECs interacts with DnaJa1, DnaJa2 and Hsc70 in vitro. (A) GFP-tagged versions of AID, the indicated APOBECs or GFP control were transiently cotransfected with Flag–DnaJa1 into HEK293T cells and immunoprecipitated with anti-GFP. Immunoprecipitates were probed by western blot. (B) As in (A) but using Flag-tagged versions of AID and the APOBECs cotransfected with Myc–DnaJa2 and immunoprecipitated with anti-Flag. (C) As in (B) but cotransfected with GFP–Hsc70. One of the two independent experiments is shown for (AC). (D) Schematic representation of AID–APOBEC2 chimeric proteins (AID–A2ch1–5) in which either one of the regions from A2 indicated between dotted lines was substituted into the homologous AID region. (E) Flag-tagged versions of AID, A2 or the AID-2 chimeras were immunoprecipitated using anti-Flag from HEK293T cell lysates cotransfected with Myc–DnaJa1 and analysed by western blot. (F) Flag-tagged versions of AID, A2 or the AID-2 chimeras were immunoprecipitated using anti-Flag from HEK293T cell lysates cotransfected with GFP–DnaJa2 and analysed by western blot.
Figure 3
Figure 3
DnaJa1 overexpression increases AID levels and antibody gene diversification. (A) CH12F3 mouse B cells transduced with pMX-ires–GFP vector either empty (GFP) or encoding untagged DnaJa1 or DnaJa2 were sorted for GFP-expressing cells, lysed and analysed by western blot using anti-DnaJa1 or anti-DnaJa2 and anti-PCNA as loading control. P, parental cells. (B) Endogenous AID from transduced and parental CH12F3 cells was analysed by western blot using the indicated antibodies before (−) and 24 h after (+) stimulation with agonist anti-CD40, IL-4 and TGF-β1 (CIT). (C) Proportion of IgA+ CH12F3 cells at day 3 post-CIT. The mean proportion of IgA+ cells determined by flow cytometry±s.d. from six independent stimulations is plotted for each population relative to the GFP controls set as 100%. (D) Endogenous AID was analysed by western blot using anti-AID on cell lysates from two representative, independently derived stable DT40 cell clones transfected with empty vector (Ctrl) or plasmids encoding myc–DnaJa1, myc–Dnaja2, myc–Hsp90 or GFP–Hsc70. Specific antibodies against each protein detected the transfected (triangles) and endogenous (circles) proteins. PCNA was used as loading control. (E) Endogenous AID levels quantified by densitometry from unsaturated western blots similar to those shown in (D) and normalized to the corresponding PCNA level. The mean value for AID in control samples set as 1 was used to normalize all values in each experiment. Data expressed as mean values±s.d. of multiple subclones for each construct are plotted (myc–DnaJa1 n=15 and myc–DnaJa2 n=21 versus controls n=18; myc–Hsp90β n=11 versus controls n=11; GFP–Hsc70 n=12 versus controls n=12). (F) Ig gene conversion frequency in transfected DT40 cells was estimated as the median proportion of IgM+ cells arising from multiple IgM subclones after 4 weeks of clonal expansion. The proportion of sIgM+ for each subclone and median values are plotted. Different symbols indicate subclones obtained from independent transfectants. In all panels, P-values from unpaired, one-tailed t-test are indicated only for significant differences (P<0.05).
Figure 4
Figure 4
Reduced AID levels and CSR in DnaJa1-depleted CH12F3 cells. (A) CH12F3 cells were transduced with a lentiviral vector carrying control shRNA (Ctrl) or one of five different mouse DnaJa1-specific shRNAs (#1–#5), selected on puromycin and analysed by western blot for DnaJa1 and PCNA as loading control. Populations obtained from two independent infections are shown. (B) DnaJa1 protein levels were estimated by densitometry from western blots of three independently infected populations and normalized to each corresponding PCNA signal. Data expressed as mean values±s.d. for each DnaJa1 shRNA are plotted relative to DnaJa1 levels in control shRNA cells set as 100% (*P<0.01, **P<0.0005, paired one-tailed t-test). (C) Proportion of IgA+ cells at day 3 post-CIT as determined for flow cytometry for the same populations used for (B). Data expressed as mean values±s.d. from six independent inductions are plotted relative to the IgA+ proportion in control shRNA cells set as 100% (*P<0.005, **P<0.0005 in paired one-tailed t-test). (D) Representative flow cytometry profiles of transduced CH12F3 stimulated with CIT for 3 days or not (no CIT) and stained with anti-IgA. The proportion of IgA+ cells is indicated in each histogram. (E) The mean reduction in CSR versus the mean reduction in DnaJa1 protein for each shRNA was plotted for two independent experiments (circles and squares) and analysed by linear regression. The correlation coefficients (R2) are indicated. (F) Western blots from two independent experiments measuring AID in CH12F3 cells transduced with control or DnaJa1 shRNAs, 24 h post-CIT. (G) CH12F3 cells transduced with control shRNA (ctrl) or one of three different mouse DnaJa2-specific shRNAs (#1–#3) were analysed as in (A). One of the two independent experiments is shown. (H) DnaJa2 protein levels were estimated and plotted as in (B). (I) The proportion of IgA+ cells at day 3 post-CIT in control versus DnaJa2-depleted cells was determined and plotted as in (C). (J) Western blot measuring AID in CH12F3 cells transduced with control or DnaJa2 shRNAs, 24 h post-CIT. (K) AID levels were measured by western blot 24 h post-CIT in CH12F3 cells transduced with shRNA control, DnaJa1 shRNA#3 or DnaJa2 shRNA#2 at 0, 4 and 8 h after treatment with 100 ng/ml CHX. PCNA is used as a loading control. One of the two independent experiments is shown. (L) AID protein levels after CHX treatment were estimated by densitometry from western blots of two independent experiments, normalized to each corresponding PCNA signal. Data expressed as mean values±s.e.m. for each time point are plotted with AID levels at t=0 h set as 100%. AID protein half-lives were calculated and are indicated.
Figure 5
Figure 5
Reduced AID protein levels and isotype switching in DNAJA1−/− mice. (A) Proportion of IgG1+ cells in purified splenic B cells from five DNAJA1−/− and control (+/+ or +/−) mice 4 days post-IL-4 and LPS stimulation, measured by flow cytometry. Two independent experiments are plotted in the same graph. A line links littermate pairs, with females (triangles) and males (circles) distinguished. (B) The data from (A) were compiled by normalizing the IgG1+ B-cell proportion from each of the DNAJA1−/− mice to its paired control set as 100%. The mean relative CSR±s.d. value for DNAJA1−/− mice is plotted. (C) Splenic naive B cells from DNAJA1−/− mice and littermate controls were loaded with CFSE, activated with IL-4 and LPS for 4 days and the proportion of IgG1+ cells for each cell division determined by flow cytometry. One representative out of four mice pairs analysed is plotted. (D) DnaJa1, AID and PCNA protein levels were analysed by western blot in lysates from resting (R) or LPS + IL-4-activated (A) splenic B cells purified from three DNAJA1−/− and their matched control littermates (pairs separated by dashed lines). AID levels in each mouse were quantified by densitometry, normalized to PCNA levels and the mean±s.d. AID levels for DNAJA1−/− mice relative to their corresponding littermate are plotted in the right-hand panel. (E) Concentration of IgM and IgG1 in sera from 3- to 5-month-old DNAJA1−/− or littermate control mice determined by ELISA. Each dot represents an individual mouse with females (triangles) and males (circles) distinguished. Horizontal lines indicate median values. (F) Six littermate pairs of control and DNAJA1−/− mice were immunized with NP15-CGG and serum samples collected at day 11 post-immunization (primary response). The mice were boosted at day 30 and sera collected again at day 37 (secondary response). Anti-NP IgG1 titres were determined by ELISA using plates coated with NP26-BSA (NP26 column, total anti-NP antibodies) or NP4-BSA (NP4 column, high affinity anti-NP antibodies). The value for each mouse is indicated, distinguishing females (triangles) and males (circles) with lines indicating median values. In all panels, P-values from paired, one-tailed Student's t-test are indicated only for statistically significant differences (P<0.05).
Figure 6
Figure 6
DnaJa1 farnesylation is necessary to maintain AID levels and for CSR. (A) DnaJa1 domains illustration indicating the deletions and single point mutation variants used. CaaX indicates the farnesylation motif where Cys394 was mutated to Ser in DnaJa1ΔF. (B) Crystal structure of the yeast DnaJa1 orthologue Ydj1 substrate-binding domain using the same colour scheme as in (A). Residues homologous to those truncated in DnaJa1ΔN2, which destroy CTDI and II, are in grey. A Ydj1 substrate peptide, which cocrytstalized bound to CTDI, is shown as filled model. Data are from pdb1NLT (Li et al, 2003). (C) Flag-tagged AID or A2 were immunoprecipitated using anti-Flag from lysates of HEK293T cells cotransfected with the indicated GFP-tagged DnaJa1 variants and analysed by WB. One of the two independent experiments is shown. (D) Similar experiment to (C) but using Myc-tagged DnaJa1 variants. One of the two independent experiments is shown. (E) Splenic B cells purified from DNAJA1+/+ and DNAJA1−/− mice activated with LPS and IL-4, transduced with retroviruses expressing control (GFP), DnaJa1–, DnaJa1ΔF– or DnaJa2-ires–GFP and analysed at day 4 post-infection by flow cytometry. Histograms show GPF-gated cells stained with anti-IgG1 indicating the proportion of IgG1+ cells for one representative out of three mice analysed. (F) Compilation of ex-vivo CSR data from three DNAJA1−/− mice complemented as in (E). The proportion of IgG1+ cells for the DNAJA1−/− B cells expressing each transduced protein is shown relative to the value obtained for the corresponding DNAJA1+/+ littermate B cells infected with control GFP vector, set as 100%. Paired, two-tailed t-test was used to evaluate significance (P<0.05). (G) Transduced splenic B cells were analysed by western blot with anti-DnaJa1 and anti-DnaJa2 using anti-GFP as loading control. (H) Ramos B-lymphoma cells and purified mouse splenic B cells were treated with the indicated concentrations of the farnesyltransferase inhibitor FTI-277 for 72 h and the levels of AID and farnesylated (circle) and non-farnesylated (triangle) DnaJa1 analysed by western blot. PCNA was used as loading control. (I) Experimental strategy used for assaying CSR in mouse splenic B cells after farnesyltransferase inhibition. D, day. (J) Relative proportion of IgG1+ cells measured by flow cytometry in mouse splenic B cells treated with the farnesyl transferase inhibitor FTI-277 or solvent control as in (I). (K) CFSE staining profile of the cells used for (I) with the proportion of IgG1+ cells for each cell division plotted below. (L) Hela cells cotransfected with GFP-tagged DnaJa1 or DnaJa1ΔF and untagged AID were treated with leptomycin B or heat shocked for 90 min at 43°C, fixed, stained with anti-AID and anti-mouse Alexa-680 and imaged by confocal microscopy. Representative confocal images are shown, scale bar=10 μm. The cellular localization of each protein was classified and the proportion of cotransfected cells showing each distribution is plotted as bars with the number of cells counted indicated (n). C, cytoplasmic; N, nuclear.

Similar articles

Cited by

References

    1. Aoufouchi S, Faili A, Zober C, D’Orlando O, Weller S, Weill J-C, Reynaud C-A (2008) Proteasomal degradation restricts the nuclear lifespan of AID. J Exp Med 205: 1357–1368 - PMC - PubMed
    1. Arakawa H, Hauschild J, Buerstedde J-M (2002) Requirement of the activation-induced deaminase (AID) gene for immunoglobulin gene conversion. Science 295: 1301–1306 - PubMed
    1. Bardwell JC, Tilly K, Craig E, King J, Zylicz M, Georgopoulos C (1986) The nucleotide sequence of the Escherichia coli K12 dnaJ+ gene. A gene that encodes a heat shock protein. J Biol Chem 261: 1782–1785 - PubMed
    1. Bhangoo MK, Tzankov S, Fan ACY, Dejgaard K, Thomas DY, Young JC (2007) Multiple 40-kDa heat-shock protein chaperones function in Tom70-dependent mitochondrial import. Mol Biol Cell 18: 3414–3428 - PMC - PubMed
    1. Brar SS, Watson M, Diaz M (2004) Activation-induced cytosine deaminase (AID) is actively exported out of the nucleus but retained by the induction of DNA breaks. J Biol Chem 279: 26395–26401 - PubMed

Publication types

Substances