. 2012 Feb;22(2):259-70.
doi: 10.1101/gr.125666.111. Epub 2011 Nov 15.

Tumor-specific retargeting of an oncogenic transcription factor chimera results in dysregulation of chromatin and transcription

Affiliations

Tumor-specific retargeting of an oncogenic transcription factor chimera results in dysregulation of chromatin and transcription

Mukund Patel et al. Genome Res. 2012 Feb.

Abstract

Chromosomal translocations involving transcription factor genes have been identified in an increasingly wide range of cancers. Some translocations can create a protein "chimera" that is composed of parts from different proteins. How such chimeras cause cancer, and why they cause cancer in some cell types but not others, is not understood. One such chimera is EWS-FLI, the most frequently occurring translocation in Ewing Sarcoma, a malignant bone and soft tissue tumor of children and young adults. Using EWS-FLI and its parental transcription factor, FLI1, we created a unique experimental system to address questions regarding the genomic mechanisms by which chimeric transcription factors cause cancer. We found that in tumor cells, EWS-FLI targets regions of the genome distinct from FLI1, despite identical DNA-binding domains. In primary endothelial cells, however, EWS-FLI and FLI1 demonstrate similar targeting. To understand this mistargeting, we examined chromatin organization. Regions targeted by EWS-FLI are normally repressed and nucleosomal in primary endothelial cells. In tumor cells, however, bound regions are nucleosome depleted and harbor the chromatin signature of enhancers. We next demonstrated that through chimerism, EWS-FLI acquired the ability to alter chromatin. Expression of EWS-FLI results in nucleosome depletion at targeted sites, whereas silencing of EWS-FLI in tumor cells restored nucleosome occupancy. Thus, the EWS-FLI chimera acquired chromatin-altering activity, leading to mistargeting, chromatin disruption, and ultimately, transcriptional dysregulation.


Figures
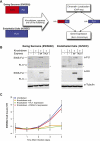
Figure 1.
Figure 1.
Experimental schema for lineage-specific transcription factor silencing and expression. (A) Ewing Sarcoma (EWS502) cells and primary human endothelial cells (HUVEC) were transduced with lentivirus expressing FLI1 3′ UTR-directed shRNA and HA epitope-tagged versions of EWS–FLI or FLI1. (B) Anti-FLI1 or anti-HA immunoblots of Ewing Sarcoma cells (EWS502) or endothelial cells (HUVEC) demonstrating concurrent silencing and replacement with HA–EWS–FLI (EF) or HA–FLI1. Tubulin serves as a loading control. Asterisks indicate where a background band runs at a similar molecular weight as endogenous FLI1. (C) After EWS–FLI1 silencing alone (Knockdown) or together with ectopic EWS–FLI1 or FLI1 expression, EWS502 cells were counted. EWS–FLI expression, but not FLI1, rescues the effect of knockdown on proliferation.
Figure 2.
Figure 2.
Chimerism alters ETS-mediated targeting. (A,B) Venn diagrams showing the number of unique and overlapping EWS–FLI and FLI1 binding regions within the same cell type (A) or across cell types (B). (C,D) UCSC Genome Browser screenshots of EWS–FLI and FLI1 ChIP-seq signal at two genes: NR0B1 (C) and EPHA2 (D). Horizontal bars indicate targeted sites identified by ZINBA. Tag counts are shown in the y-axis. (E) Meta-gene profile of EWS–FLI and FLI1 ChIP-seq reads; 1 kb upstream of the TSS through 1 kb downstream from transcriptional termination is represented. (F) Percent overlap of ZINBA-identified EWS–FLI and FLI1 binding sites with major functional genomic features. Genomic distribution of features (Genome) is shown for comparison.
Figure 3.
Figure 3.
Hierarchical clustering identifies cell and transcription factor–specific variation in genomic targeting. (A) Hierarchical clustering of 6525 binding sites that exhibited the widest variation in signal across transcription factors or cell types. Each row was median-centered and colored based on the average read count across the region. (B) Distance (bp) from the transcriptional start site of the union set of differentially expressed genes to the closet site from clusters 1–6. (C) Number of EWS–FLI or FLI1 differentially expressed genes in HUVEC containing a cluster 5 (left) or cluster 6 (right) site within 25 kb of its TSS, compared with 10,000 permutations of all RefSeq genes. (D) Normalized log2 ChIP-seq signal around the midpoint of identified de novo transcription factor motifs derived from the sequences underlying sites in each cluster. Clusters 1 and 2 were merged for the composite GGAA microsatellite motif (1362 rows). Clusters 3–6 were merged for ETS (682 rows), ETS–AP1 (2780 rows), AP1 (1903 rows), and GATA (812 rows). Color was assigned on a log2 scale from 0.5 to 9.
Figure 4.
Figure 4.
EWS–ETS fusions target GGAA-containing microsatellite repeats. (A) Tandem GGAA repeats identified in EWS–FLI and FLI1 binding sites in EWS502 and HUVEC were compared with those detected by 1000 permutations of the identical number of regions over the mappable genome, maintaining chromosomal distribution. All lengths exceeding one repeat were significant to P < 0.0001. To permit plotting lengths for which the permuted value was zero, 0.1 was added to each observed and expected value. (B) The lengths of repeat regions annotated by RepeatMasker bound by EWS–FLI in EWS502 were compared with those unbound in mappable regions of the genome. Regions bound by EWS–FLI contained significantly longer repeats as measured by a t-test. (C) ChIP–qPCR on chromatin isolated from EWS502 cells expressing the various Ewing Sarcoma fusions. Results are shown as a percent of input control. Overall, greater binding is identified at EWS–FLI-bound regions near differentially expressed genes that contained GGAA repeats (NR0B1, CAV1, GSTM4, JAK1, IGF1) compared with those that bound EWS–FLI but did not harbor a repeat (NKX2-2, KIF14, JAK1, CDKN1A, MDM2). Five control repeat-containing regions are included, and error bars represent the standard error of three replicates. (Inset) Western blot showing exogenous expression of HA–EWS–FLI, HA–FUS–ERG, and HA–EWS–ERG in EWS502 cells. Tubulin serves as a loading control.
Figure 5.
Figure 5.
Deregulation of repetitive elements in Ewing Sarcoma. (A) Heatmap of normalized ChIP and FAIRE signal ±3 kb around TSS ranked by gene expression in Ewing cells. Color was assigned on a log2 scale of −3 to 3 for ChIP and −6 to −2 for FAIRE. (B) Normalized ChIP and FAIRE signals around the centers of GGAA repeats in five ENCODE cell lines (GM12878, black; HUVEC, red; K562, blue; NHEK, green; H1hESC, orange). Mapability of the underlying DNA sequence is represented on a scale of 0 (ambiguous) to 1 (unique) and is plotted in gray. (C) Normalized ChIP and FAIRE signals around the centers of EWS–FLI-bound (left) or -unbound (right) GGAA repeats in Ewing Sarcoma cells. Mapability of the underlying DNA sequence is represented on a scale of 0 (ambiguous) to 1 (unique) and is plotted in gray. (D) Enrichment of EWS–FLI-bound GGAA repeats for RNA polymerase II (left) and histone H3 (right) in Ewing cells (red) and HUVEC (blue), as assayed by ChIP–qPCR. All values are represented as the fold-change relative to the average of the negative controls; fold-change values are centered on 1. Error bars represent the standard error from three technical replicates.
Figure 6.
Figure 6.
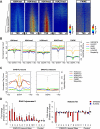
The EWS–FLI complex is capable of altering chromatin. (A) Normalized signals for H3K4me1 (black), H3K4me2 (red), H3K4me3 (blue), H3K27me3 (green), and FAIRE (orange) from both EWS502 and HUVEC are plotted for the 2-kb region surrounding the summits of sites identified by hierarchical clustering. (B) Change in FAIRE enrichment at EWS–FLI-bound GGAA repeats following EWS–FLI expression in HUVEC. All values are represented as fold-change relative to scrambled shRNA control. Error bars represent the standard error from three technical replicates. (C) Change in FAIRE enrichment at EWS–FLI-bound GGAA repeats following EWS–FLI silencing in EWS502. All values are represented as fold change relative to scrambled shRNA control. Error bars represent the standard error from three technical replicates.

References

    1. Bartel FO, Higuchi T, Spyropoulos DD 2000. Mouse models in the study of the Ets family of transcription factors. Oncogene 19: 6443–6454 - PubMed
    1. Bassuk AG, Leiden JM 1995. A direct physical association between ETS and AP-1 transcription factors in normal human T cells. Immunity 3: 223–237 - PubMed
    1. Benjamin LE, Fredericks WJ, Barr FG, Rauscher FJ 3rd 1996. Fusion of the EWS1 and WT1 genes as a result of the t(11;22)(p13;q12) translocation in desmoplastic small round cell tumors. Med Pediatr Oncol 27: 434–439 - PubMed
    1. Bernheim A 2010. Cytogenomics of cancers: from chromosome to sequence. Mol Oncol 4: 309–322 - PMC - PubMed
    1. Bernstein BE, Mikkelsen TS, Xie X, Kamal M, Huebert DJ, Cuff J, Fry B, Meissner A, Wernig M, Plath K, et al. 2006. A bivalent chromatin structure marks key developmental genes in embryonic stem cells. Cell 125: 315–326 - PubMed

Publication types

MeSH terms