. 2012 Jan 12;119(2):422-33.
doi: 10.1182/blood-2011-05-353789. Epub 2011 Nov 15.

Human MAIT and CD8αα cells develop from a pool of type-17 precommitted CD8+ T cells

Affiliations

Human MAIT and CD8αα cells develop from a pool of type-17 precommitted CD8+ T cells

Lucy J Walker et al. Blood. .

Abstract

Human mucosal associated invariant T (MAIT) CD8(+) and Tc17 cells are important tissue-homing cell populations, characterized by high expression of CD161 ((++)) and type-17 differentiation, but their origins and relationships remain poorly defined. By transcriptional and functional analyses, we demonstrate that a pool of polyclonal, precommitted type-17 CD161(++)CD8αβ(+) T cells exist in cord blood, from which a prominent MAIT cell (TCR Vα7.2(+)) population emerges post-natally. During this expansion, CD8αα T cells appear exclusively within a CD161(++)CD8(+)/MAIT subset, sharing cytokine production, chemokine-receptor expression, TCR-usage, and transcriptional profiles with their CD161(++)CD8αβ(+) counterparts. Our data demonstrate the origin and differentiation pathway of MAIT-cells from a naive type-17 precommitted CD161(++)CD8(+) T-cell pool and the distinct phenotype and function of CD8αα cells in man.


Figures

Figure 1
Figure 1
MAIT cell and CD161++CD8+ populations are overlapping subsets. (A) CD3+CD161++Vα7.2+ T cells are predominantly CD8αα+ and CD8αβ+ cells. Left hand panel shows representative FACS plots of coreceptor usage by Vα7.2+ T cells. Cumulative data shown in right hand panel. ***P < .001 (1-way ANOVA). (B) Representative FACS plots show a prominent CD8α+CD8β population exclusive to the CD161++CD8α+ subset in peripheral blood. Data representative of 20 healthy donors. (C) CD161++CD8α+ T cells are predominantly Vα7.2+ (mean 87% Vα7.2+) compared with the CD161+ and CD161 CD8α+ subsets. **P < .001 (1-way ANOVA).
Figure 2
Figure 2
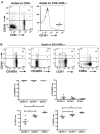
A naive CD161++CD8α+ T-cell population can be identified in cord blood. (A) Representative FACS plot shown of cord blood showing the CD161++CD8α+ cell population. Data representative of 22 cord samples. (B) CD161++CD8α+ T cells in cord blood are CD45RA+, CD45RO, CCR7low, and CD62Llow. Representative FACS plots and cumulative data shown. **P < .001, *P < .05 (1-way ANOVA).
Figure 3
Figure 3
CD161++CD8α+ T cells in cord blood are a preprogrammed type-17 subset. (A) Comparison of log fold change in gene expression for selected genes between CD161++CD8α+ versus CD161CD8α+ T cells in adult and cord blood. Data obtained from 3 cord samples and 3 adult healthy donors. (B) Gene set enrichment summary plots comparing gene expression on microarray analysis between CD161++CD8α+ versus CD161CD8α+ subsets from adult and cord blood. Left panel shows the plot for up-regulated genes, right hand panel shows plot for down-regulated genes. Normalized enrichment score (NES), up-regulated genes, = 4.21, P < .00001. NES, down regulated genes, = -3.25, P < .0001. (C) Representative FACS plots and cumulative date showing CD161++ CD8α+ cells in cord blood express high levels of IL-18R and CCR6. **P < .001 (1-way ANOVA). (D) Relative fold change in gene expression for RORC, ZBTB16, IL-18RAP, and IL-23R in CD161++CD8α+ compared with the CD161+ and CD161CD8α+ subsets in cord blood by real time PCR analysis.
Figure 4
Figure 4
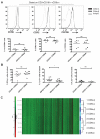
Distinct phenotypic and functional features of the CD161++CD8α+ population are shared between the CD161++ CD8αα+ and CD8αβ subsets. (A) Representative histograms showing CD161++ CD8αα+ and CD8αβ cells to express CCR6, CCR2, and CXCR6. Cumulative data shown. ns = non significant (Mann-Whitney test). (B) Cumulative data showing expression of IFN-γ, IL-17 and IL-22 by CD161++ CD8αα and CD8αβ cells. *P = .0467, ns = non significant (Mann- Whitney). (C) Heat-map showing up (red) and down (green) regulated gene expression of CD161++CD8αα (light blue) compared with CD8αβ (dark blue) cells on microarray.
Figure 5
Figure 5
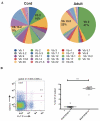
CD161++CD8α+ T cells in cord blood have broad T-cell receptor usage compared with adults. (A) Comparison of proportional TCR Vβ usage by CD161++CD8α+ T cells between cord and adult blood using TCR Vβ antibody panel. Data obtained from 8 cord blood samples and 10 adult healthy donors. (B) Representative FACS plot of Vα7.2 usage by CD161++/+/− subsets in cord blood (C) Comparison of TCR Vα 7.2 usage between the CD161++CD8α+ subsets in cord and adult blood. ***P = .002 (Mann-Whitney).
Figure 6
Figure 6
The CD161++ CD8αα population emerges on expansion of the CD161++CD8αβ subset with age. (A) CD161++ CD8αα cells are not found in cord or infant blood. (B) Comparison of CD161++CD8α+ and CD161++CD8αα populations in cord, infant, and adult blood. **P < .001, ***P < .0001 (1-way ANOVA). (C) Comparison of TCR Vβ and Vα usage between CD161++ CD8αβ and CD161++CD8αα subsets in adult blood.
Figure 7
Figure 7
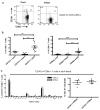
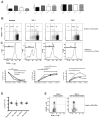
CD161++ CD8αα T cells can be derived from CD161++CD8αβ cells in culture. (A) CD161++, CD161+ and CD161 populations of the CD8 enriched/CD8β+ selected PBMCs remain stable over the 7 days of culture in R10 media alone. (B) Representative FACS plots demonstrating change in CD8β expression of CD161++, CD161+ and CD161 populations of the CD8 enriched/CD8β+ selected PBMCs in media alone over 7 days of culture. CD8αα population seen only in CD161++ population. (C) Representative histograms showing change in CD8β expression of the CD161++CD8α+ population of the CD8 enriched/CD8β+ selected PBMCs over 7 days of culture (top panel). Cumulative data shown (bottom panel), *P < .05, **P < .001, and ***P < .0001 (1-way ANOVA). Data representative of 4 experiments. (D) Cumulative data showing no significant change in the CD8α+ T-cell population of cultures over course of experiment (1-way ANOVA). (E) Ki-67 proliferation data for sorted CD8β+ cells left in culture media alone or with CD3/CD28 beads for 48 hours. Baseline Ki-67 staining (gray), after culture Ki-67 staining (black). Data representative of 2 experiments.

References

    1. Martin E, Treiner E, Duban L, et al. Stepwise development of MAIT cells in mouse and human. PLoS Biol. 2009;7(3):e54. - PMC - PubMed
    1. Billerbeck E, Kang YH, Walker L, et al. Analysis of CD161 expression on human CD8+ T cells defines a distinct functional subset with tissue-homing properties. Proc Natl Acad Sci U S A. 2010;107(7):3006–3011. - PMC - PubMed
    1. Dusseaux M, Martin E, Serriari N, et al. Human MAIT cells are xenobiotic-resistant, tissue-targeted, CD161hi IL-17-secreting T cells. Blood. 2011;117(4):1250–1259. - PubMed
    1. Annibali V, Ristori G, Angelini DF, et al. CD161(high)CD8+T cells bear pathogenetic potential in multiple sclerosis. Brain. 2011;134(Pt 2):542–554. - PubMed
    1. Cosmi L, De Palma R, Santarlasci V, et al. Human interleukin 17-producing cells originate from a CD161+CD4+ T cell precursor. J Exp Med. 2008;205(8):1903–1916. - PMC - PubMed

Publication types

MeSH terms