. 2012 Feb 2;119(5):1228-39.
doi: 10.1182/blood-2011-07-365346. Epub 2011 Nov 15.

Contrasting dynamic responses in vivo of the Bcl-xL and Bim erythropoietic survival pathways

Affiliations

Contrasting dynamic responses in vivo of the Bcl-xL and Bim erythropoietic survival pathways

Miroslav Koulnis et al. Blood. .

Abstract

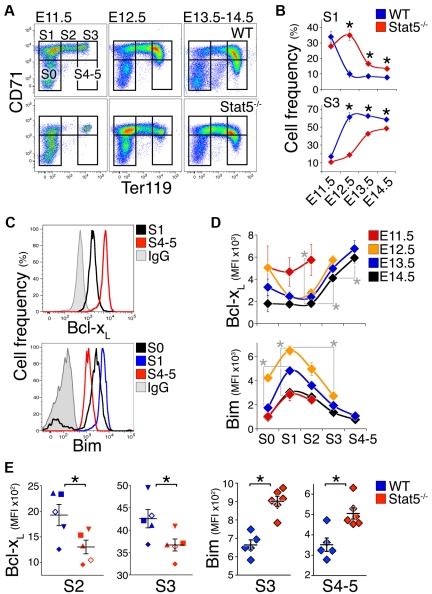
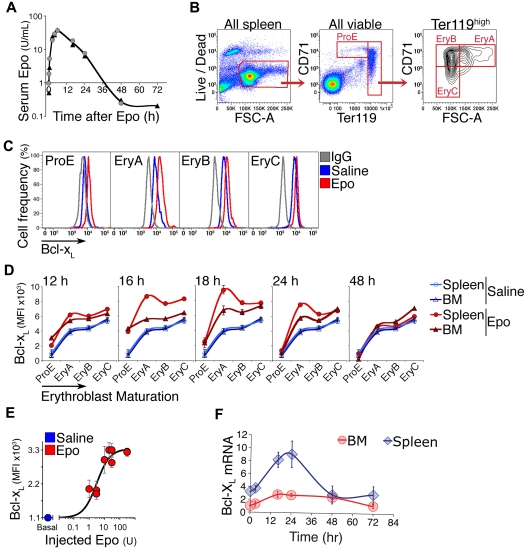
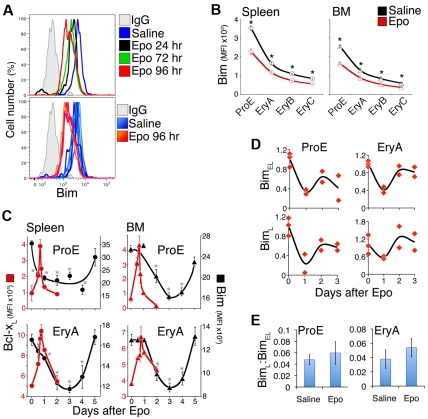
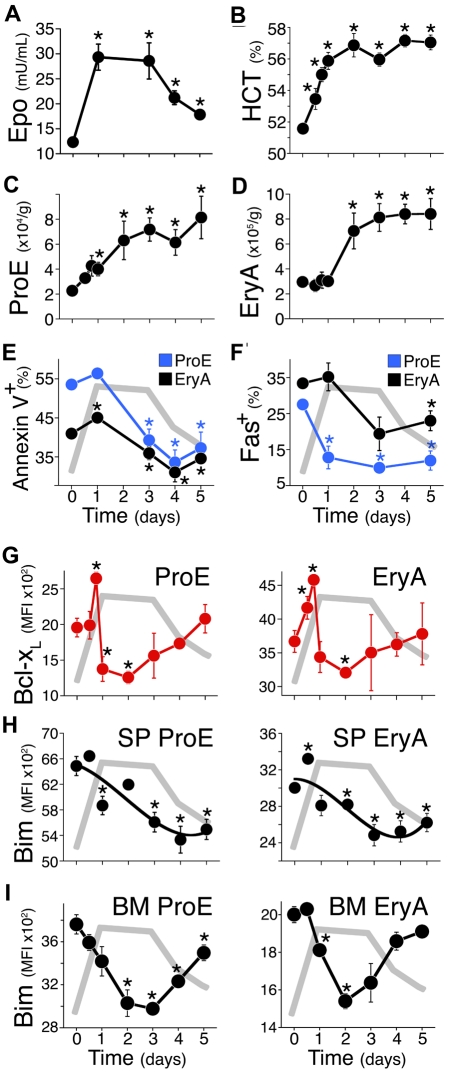
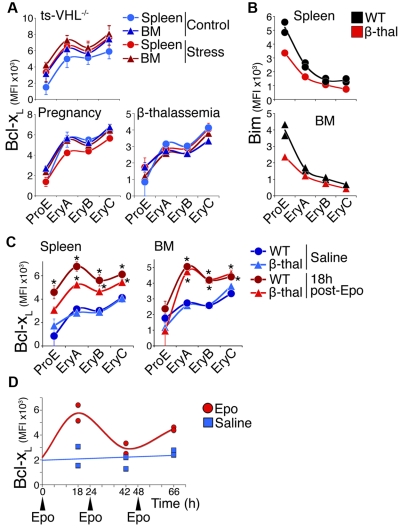
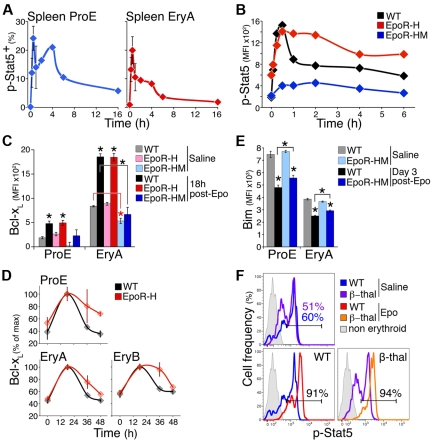
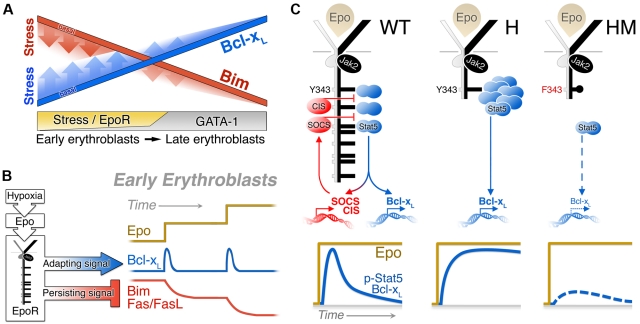
Survival signaling by the erythropoietin (Epo) receptor (EpoR) is essential for erythropoiesis and for its acceleration in hypoxic stress. Several apparently redundant EpoR survival pathways were identified in vitro, raising the possibility of their functional specialization in vivo. Here we used mouse models of acute and chronic stress, including a hypoxic environment and β-thalassemia, to identify two markedly different response dynamics for two erythroblast survival pathways in vivo. Induction of the antiapoptotic protein Bcl-x(L) is rapid but transient, while suppression of the proapoptotic protein Bim is slower but persistent. Similar to sensory adaptation, however, the Bcl-x(L) pathway "resets," allowing it to respond afresh to acute stress superimposed on a chronic stress stimulus. Using "knock-in" mouse models expressing mutant EpoRs, we found that adaptation in the Bcl-x(L) response occurs because of adaptation of its upstream regulator Stat5, both requiring the EpoR distal cytoplasmic domain. We conclude that survival pathways show previously unsuspected functional specialization for the acute and chronic phases of the stress response. Bcl-x(L) induction provides a "stop-gap" in acute stress, until slower but permanent pathways are activated. Furthermore, pathologic elevation of Bcl-x(L) may be the result of impaired adaptation, with implications for myeloproliferative disease mechanisms.


Figures

Figure 1
Figure 1
Delayed maturation and altered Bcl-xL and Bim expression in Stat5−/− fetal liver. (A) Representative flow cytometric CD71/Ter119 fluorescence profiles of Stat5−/− fetal livers and wild-type littermates freshly isolated on consecutive embryonic days (E11.5 to E14.5). S0 to S4/5 are increasingly differentiated erythroid progenitors and precursors subsets in the fetal liver. Dead cells were excluded using LIVE/DEAD viability dye. (B) Summary of analysis performed as in panel A. Data points are each mean ± SEM of 4 to 21 embryos. Statistically significant differences between wild-type and Stat5−/− subsets (★) were found for S1 on E12.5 (P = .002, 2-tailed t test, unequal variance), E13.5 (P = .00001), and E14.5 (P = .014) and for S3 on E12.5 (P = .005), E13.5 (P = .00004), and E14.5 (P = .010). (C) Representative flow cytometry histograms for the Bcl-xL and Bim proteins in the indicated fetal liver subsets. Freshly isolated wild-type E14.5 fetal liver cells were stained with CD71, Ter119, and the LIVE/DEAD viability dye, and were then fixed, permeabilized, and stained intracellularly with an anti–Bcl-xL antiserum or nonimmune antiserum control (IgG), or with anti-Bim Ab or IgG isotype control. The x-axis is in fluorescence units. (D) Bcl-xL and Bim protein levels, measured as in panel C, in fresh wild-type fetal liver subsets S0 to S4/5 at the indicated embryonic days. Data were pooled from several experiments with multiple litters. Data points are each the median fluorescence intensity (MFI) ± SEM of 4 to 14 embryos or 6 embryos for Bcl-xL and Bim measurements, respectively. Nonspecific background fluorescence, defined as the MFI of the corresponding subset stained with control IgG, was subtracted. On E13.5 and E14.5, there were significant differences between S2 and S3 (P ≤ .0001), and between S3 and S4/5 (P < .001, paired t test). Statistically significant differences in Bim expression were found for S1 between E11.5 and E12.5 (P < .0001, 2-tailed t test, unequal variance). On E12.5, there were significant differences between S0 and S1 (P < .0001), and between S1 and S3 (P < .0001). Similar developmental patterns were observed in C57BL/6 and Balb/C backgrounds. (E) Lower Bcl-xL and higher Bim levels in E14.5 Stat5−/− embryos compared with wild-type littermate controls, at the indicated differentiation subset. For Bcl-xL, n = 11 to 21 embryos per genotype, with each symbol type representing median expression for 1 litter. Means ± SEM for the population are indicated. Statistically significant differences were found for S2 (P = .03), S3 (P = .002, paired t test). For Bim, data points are individual embryos. Mean ± SEM for the population is shown. Statistically significant differences were found for S3 and S4-5 (P < .01, 2-tailed t test, unequal variance).
Figure 2
Figure 2
Bcl-xL is induced in adult early erythroblasts in response to Epo injection. (A) Time course of plasma Epo, assayed by ELISA, after a single subcutaneous injection of 300 U/25 g body weight. Two mice (identified as either circles or triangles) were assayed per time point. (B) Gating strategy for freshly explanted adult splenic erythroid subsets ProE, EryA, EryB, and EryC. Live cells were selected, and subsets gated based on Ter119, CD71, and forward scatter (FSC). The spleen illustrated in this panel was harvested 18 hours after a subcutaneous Epo injection. All axes units refer to fluorescence. (C) Representative flow cytometric histograms of Bcl-xL in the indicated spleen erythroblast subsets. Anti–Bcl-xL antiserum was used to stain erythroblasts from a saline-injected mouse (blue histograms), or an Epo-injected mouse (300 U/25 g, red histograms) in freshly explanted spleen at 18 hours postinjection. Nonimmune serum (IgG) was used to measure the nonspecific binding in each subset (gray histograms). The x-axis is in fluorescence units. (D) Bcl-xL expression measured as in panel C in freshly explanted spleen, in each erythroblast subset at each of the indicated time points after a single Epo injection (300 U/25 g). Each data point for Epo-injected mice is mean ± SEM of n = 4 mice for t = 16, 18, 24, 48 hours, and mean of 2 mice for t = 12 hours. Blue curves are mean ± SEM of n = 14 saline-injected mice pooled from all time points. The same blue curves are reproduced for comparison with Epo-injected mice at each time point. Statistical significance values: ProE at t = 16 hours, in BM *P = .005, in spleen *P = .0006. EryA in spleen, *P = .0009 at 16 hours, *P = .0009 at 18 hours. EryA in BM, *P = .013 at 16 hours, *P = .015 at 18 hours. The induction of Bcl-xL in splenic EryA was significantly higher than in BM EryA (*P = .021). Two-tailed t test with unequal variance was used for all comparisons. (E) Epo dose/Bcl-xL response in vivo in spleen EryA. Wild-type Balb/C mice were injected subcutaneously with either saline (= basal, blue circle) or a single dose of Epo (1, 3, 10, 20, 30, or 300 U/25 g, red circles). Bcl-xL was measured by flow cytometry as in panel C at 18 hours postinjection, with the nonspecific fluorescence reading subtracted for each subset. Data from 2 independent experiments were pooled and normalized. Data points were fitted with a Hill curve. Each data point represents mean ± SEM of n = 3 to 4 mice. (F) Time course of Bcl-xL mRNA levels after a single Epo injection (300 U/25 g), in freshly isolated and sorted spleen and BM EryA. Quantitative real-time PCR (qRT-PCR), data points are mean ± SEM of 3 independent experiments. Data are expressed relative to the β-actin mRNA and normalized to the value in BM EryA in saline-injected mice.
Figure 3
Figure 3
Transient Bcl-xL induction contrasts with slower Bim suppression in response to Epo injection. (A) Flow cytometric histograms of Bim in freshly harvested splenic ProE. (Top panel) Histograms corresponding to single mice at the indicated time points after Epo injection, or 24 hours after control saline injection. Bim levels decrease (histograms shift to the left) after Epo injection. (Bottom panel) Bim levels in 6 saline-injected mice (6 histograms in various shades of blue) and 3 Epo-injected mice (histograms in shades of red/orange). The x-axis is in fluorescence units. (B) Bim protein levels, measured as illustrated in panel A, in adult erythroid differentiation subsets 3 days after a single injection of either Epo (red, 300 U/25 g) or saline (black). Data are mean ± SEM of n = 21 mice for saline injection, and n = 10 mice for Epo injection. *P < .00001 (2-tailed t test, unequal variance) for differences between Epo and saline-injected mice. (C) Time course of Bcl-xL up-regulation (red symbols, plotted on the left, red-numbered y-axis) and Bim suppression (black symbols, plotted on the right, black-numbered y-axis) in spleen (circles) and BM (triangles) in response to a single Epo injection (300 U/25 g) on day 0. Includes a subset of the data plotted in panel B (for Bim) and Figure 2D (for Bcl-xL). Bim data are mean ± SEM of n = 21 mice for day 0, and n = 3 to 10 mice for days 1 to 5, pooled from 5 experiments. Bim ProE curves (black lines) for spleen and BM were hand-drawn. Bim on day 0 was significantly different from subsequent days, where indicated: spleen ProE: *P < .005; spleen EryA: *P < .025; BM ProE: *P < .02; BM EryA: *P < .01 (2-tailed t test, unequal variance). (D) Time course of BimL and BimEL mRNA levels after a single Epo injection (300 U/25 g), in freshly isolated and sorted BM EryA and ProE. Each data point is the mean of triplicate qRT-PCR measurements on sorted cells from individual mice, expressed relative to the β-actin mRNA and normalized to t = 0 (saline-injected mice). There was a significant decrease after Epo injection in BimEL mRNA in ProE (P = .00439, 2-tailed t test, unequal variance, all post-Epo injection data were pooled) and EryA (P = .013), and in BimL mRNA in ProE (P = .027). (E) The ratio of BimL to BimEL mRNA in Epo-injected and in saline-injected mice, in the experiments described in panel D. Data are mean ± SD; all Epo time points were pooled for the purpose of this analysis. There were no significant changes in this ratio with Epo injection.
Figure 4
Figure 4
A reduced-oxygen environment elicits a rapid, transient Bcl-xL induction and a slower, persistent Bim suppression. (A-I) Mice were placed in a low oxygen chamber (11%) on day 0, for up to 5 days. (A) Endogenous plasma Epo, assayed by ELISA. Data are mean ± SEM. Epo was significantly elevated relative to day 0 (n = 27 mice) on all subsequent days (n = 6 to 12 mice per time point, P < .006, 2-tailed t test, unequal variance). The Epo time course is redrawn in gray in panels E to I. (B) Daily hematocrit (HCT) of blood collected immediately after euthanasia. Data are mean ± SEM of n ≥ 6 mice per time point. Differences from day 0 were significant at 12 hours (P = .019), 18 hours to day 5 (P < .0002). (C-D) Spleen ProE and EryA (cell number per gram body weight). Data pooled from 23 independent experiments. Each data point is mean ± SEM of n ≥ 6 mice. Differences from day 0 (n = 82 mice) were significant for ProE on day 1 (P = .005), day 2 (P = .047), days 3 to 5 (P ≤ .005), and for EryA on day 2 (P = .034), days 3 to 5 (P ≤ .001). (E) Annexin V binding in spleen ProE (blue) and EryA (black). Data points are mean ± SEM of 33 mice for day 0, and 3 to 7 mice for subsequent days, pooled from 2 to 5 independent experiments per day. Differences from day 0 are significant for ProE on days 3 to 5 (P ≤ .002), and for EryA on day 1 (P = .001) and days 3 to 5 (P = .03, 0.02, 0.001, respectively). (F) Fas-positive cell frequency in spleen ProE (blue) and EryA (black), measured by flow cytometry in freshly explanted tissue. Data are mean ± SEM of n = 26 mice pooled from 4 experiments (day 0), or n = 3 mice for subsequent days. Differences from day 0 were significant for ProE on day 1 (P = .024), day 3 (P < .00001), day 5 (P = .001), and for EryA on day 5 (P = .04). (G) Bcl-xL protein in spleen ProE and EryA measured by flow cytometry in freshly explanted tissue. Data pooled from 3 independent experiments. Each data point is mean ± SEM of n ≥ 3 mice. Differences from day 0 (n = 17) are significant for ProE at 18 hours (n = 3, P < .001), 24 hours (n = 7, P = .019), 48 hours (n = 5, P < .0005), and for EryA, at 12 hours (P = .046), 18 hours (P < .0001), 48 hours (P = .02). (H-I) Bim protein expression in spleen (H) and BM (I) ProE and EryA, measured by flow cytometry in freshly explanted tissue. Data are mean ± SEM of n ≥ 3 mice. Differences from day 0 were significant for spleen ProE on day 1 (P = .014), days 3 to 5 (P ≤ .005), spleen EryA on day 0.5 (P = .0014), days 2 to 5 (P < .04), BM ProE on day 2 (P = .007), day 3 (P < .00001), day 4 (P < .001), day 5 (P = .04), BM EryA on day 1 (P = .002), day 2 (P = .0001), day 3 (P = .05).
Figure 5
Figure 5
The Bcl-xL response to chronic stress and to acute-on-chronic stress. (A) Bcl-xL expression in mouse models of erythropoietic stress (red symbols) and matched controls (blue symbols), measured in freshly explanted tissue. Each data point is mean ± SEM of 2 to 4 mice. There were no statistically significant differences between chronic stress and control mice. (B) Representative experiment showing Bim expression in β-thalassemia mice in spleen (top) and BM (bottom). Two wild-type (black symbols) and 1 β-thalassemia mouse (red symbols) are shown. (C) The Bcl-xL response to an acute-on-chronic stimulus. Bcl-xL was measured in spleen and BM erythroblasts in β-thalassemia and matched control mice, 18 hours after a single injection of either Epo (300 U/25 g, red symbols) or saline (blue symbols). Data points are mean ± SEM of n = 3 to 4 mice. Representative of 4 independent experiments. There were statistically significant differences in Bcl-xL between Epo and saline injections in wild-type spleen ProE (P = .025, 2-tailed t test, unequal variance), EryA (P = .0009), EryB (P = .01), and EryC (P = .006); in β-thalassemia spleen EryA (P = .0004), EryB (P = .004), and EryC (P = .03); in wild-type BM EryA, EryB, and EryC (P ≤ .0005); and in β-thalassemia BM EryA, EryB (P < .0005), and EryC (P = .025). The increase in spleen EryA Bcl-xL was significantly higher (P = .023) in wild-type mice than in β-thalassemia mice. (D) The Bcl-xL response to 3 consecutive Epo injections. Wild-type mice were injected at time points 0, 24, and 48 hours with either Epo (300 U/25 g, indicated with arrowheads) or with saline. Bcl-xL in spleen EryA was assayed by flow cytometry in 2 mice for each treatment, 18 hours after each injection.
Figure 6
Figure 6
Adaptation in the Bcl-xL and p-Stat5 responses is dependent on the EpoR C-terminal cytoplasmic domain. (A) The p-Stat5 response to Epo in vivo in freshly explanted spleen ProE and EryA at the indicated times after a single Epo injection (300 U/25 g). Data were pooled from 4 independent experiments. Each time point is the mean ± SEM of data from 2 to 4 mice. (B) The p-Stat5 time course in S1 fetal liver cells in response to Epo stimulation (2 U/mL), shown for EpoR-HM, EpoR-H, and matched wild-type fetal livers at E13.5. Data are MFI above background (isotype-control Ab). Representative of 3 similar experiments. (C) The Bcl-xL response to Epo in vivo in EpoR-H and EpoR-HM mice. Bcl-xL was measured 18 hours after a single injection of either saline or Epo (300 U/25 g), in freshly explanted spleen ProE and EryA of EpoR-H, EpoR-HM, or wild-type controls. Data are mean ± SEM of n = 3 to 5 mice per bar. Significant Bcl-xL increase from basal levels in spleen ProE and EryA was seen in Epo vs saline-injected wild-type (black) and EpoR-H (red) mice (stars without brackets: WT ProE *P = .003; EpoR-H ProE *P = .012; WT EryA *P = .00004; EpoR-H EryA *P = .0001, 2-tailed t test, unequal variance), but not in EpoR-HM mice (blue). Bcl-xL was reduced in basal state EpoR-HM spleen EryA (red star with red bracket, *P = .027) compared with wild-type basal control. Bcl-xL induction in wild-type spleen EryA was significantly above that of EpoR-HM EryA (black star with bracket, *P = .007). (D) Time course of the Bcl-xL response in EpoR-H mice and in matched wild-type controls, after a single Epo injection (300 U/25 g). Measurements were made in freshly explanted spleen at the indicated time points. Bcl-xL is significantly higher in EpoR-H at 36 and 48 hours (P < .005, paired t test on all subsets). (E) Bim protein in spleen ProE and EryA of wild-type and EpoR-HM mice on day 3 after a single Epo injection (300 U/25 g). Data are mean ± SEM of n = 4 to 5 mice per bar. There was no significant difference in basal Bim between EpoR-HM and wild-type control mice. Bim was significantly suppressed after Epo injection (*P < .001). Bim was suppressed by a significantly smaller extent in EpoR-HM ProE and EryA subsets (stars with brackets, *P = .03 and *P = .001, respectively, 2-tailed t test, unequal variance). (F) The p-Stat5 histograms in vivo at peak response (30 minutes) after a single injection of either Epo (300 U/25 g) or saline, in either β-thalassemia mice or in matched wild-type controls, measured in freshly explanted spleen ProE. The p-Stat5+ gate was drawn based on the nonerythroid population in spleen (gray histograms). The x-axis is in fluorescence units.
Figure 7
Figure 7
Regulation of Bcl-xL and Bim expression in erythropoiesis. (A) Model depicting expression of Bcl-xL (red) and Bim (blue) in the late and early erythroblast compartments, in basal erythropoiesis (solid lines) and during stress (fading shaded area). GATA-1 induces Bcl-xL and suppresses Bim during erythroid differentiation, with maximal responses achieved in late erythroblasts. The effects of EpoR during stress are superimposed on the basal pattern generated by GATA-1. EpoR signaling operates principally in the early erythroblast compartment, accelerating both Bim suppression and Bcl-xL induction. (B) Contrasting dynamic stress responses of the Bcl-xL, Bim and Fas pathways, all driven by the EpoR in the early erythroblast compartment. A sudden increase in stress drives a rapid, but transient, adapting Bcl-xL response. This response is reactivated with a further change in the stress level, but is insensitive to the absolute level of stress. Bim and Fas suppression in response to stress are slower but persistent and reflects the level of stress. (C) Mechanism of adaptation in the Bcl-xL response. In wild-type mice, p-Stat5 activates the transcription of negative regulators of Jak2 and Stat5 such as SOCS3, SOCS2, and CIS, which bind the EpoR distal cytoplasmic domain, limiting the duration of both the p-Stat5 and the Bcl-xL responses. In EpoR-H mice, absence of the distal EpoR domain results in a prolonged response and loss of adaptation. In EpoR-HM mice, both p-Stat5 activation and induction Bcl-xL are drastically attenuated because of the absence of Stat5 phosphotyrosine docking sites on the EpoR-HM mutant receptor.

References

    1. Erslev AJ, Caro J. Erythropoietin titers in response to anemia or hypoxia. Blood Cells. 1987;13(1-2):207–216. - PubMed
    1. Lodish HF, Ghaffari S, Socolovsky M, Tong W, Zhang J. Intracellular signaling by the erythropoietin receptor. In: Elliott SG, Foote M, Molineux G, editors. Erythropoietins, Erythropoietic Factors, and Erythropoiesis: Molecular, Cellular, Preclinical, and Clinical Biology. Basel, Switzerland: Birkhäuser; 2009. pp. 155–174.
    1. Koury MJ, Bondurant MC. The molecular mechanism of erythropoietin action. Eur J Biochem. 1992;210(3):649–663. - PubMed
    1. Koury MJ, Bondurant MC. Erythropoietin retards DNA breakdown and prevents programmed death in erythroid progenitor cells. Science. 1990;248(4953):378–381. - PubMed
    1. Liu Y, Pop R, Sadegh C, Brugnara C, Haase VH, Socolovsky M. Suppression of Fas-FasL coexpression by erythropoietin mediates erythroblast expansion during the erythropoietic stress response in vivo. Blood. 2006;108(1):123–133. - PMC - PubMed

Publication types

MeSH terms