. 2012 Jan;40(1):e8.
doi: 10.1093/nar/gkr956. Epub 2011 Nov 15.

Increased in vivo inhibition of gene expression by combining RNA interference and U1 inhibition

Affiliations

Increased in vivo inhibition of gene expression by combining RNA interference and U1 inhibition

Lorea Blazquez et al. Nucleic Acids Res. 2012 Jan.

Abstract

Inhibition of gene expression can be achieved with RNA interference (RNAi) or U1 small nuclear RNA-snRNA-interference (U1i). U1i is based on U1 inhibitors (U1in), U1 snRNA molecules modified to inhibit polyadenylation of a target pre-mRNA. In culture, we have shown that the combination of RNAi and U1i results in stronger inhibition of reporter or endogenous genes than that obtained using either of the techniques alone. We have now used these techniques to inhibit gene expression in mice. We show that U1ins can induce strong inhibition of the expression of target genes in vivo. Furthermore, combining U1i and RNAi results in synergistic inhibitions also in mice. This is shown for the inhibition of hepatitis B virus (HBV) sequences or endogenous Notch1. Surprisingly, inhibition obtained by combining a U1in and a RNAi mediator is higher than that obtained by combining two U1ins or two RNAi mediators. Our results suggest that RNAi and U1i cooperate by unknown mechanisms to result in synergistic inhibitions. Analysis of toxicity and specificity indicates that expression of U1i inhibitors is safe. Therefore, we believe that the combination of RNAi and U1i will be a good option to block damaging endogenous genes, HBV and other infectious agents in vivo.


Figures
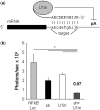
Figure 1.
Figure 1.
Schematic of U1i and inhibition of Notch1 in vivo. (a) Schematic of U1-mediated inhibition. U1in are exogenous 5′-end modified U1 snRNPs designed to base pair to the 3′-terminal exon of a target gene. In this study, the U1in binds Notch1 or HBV mRNA and blocks expression by hindering polyadenylation (pA). (b) C57BL/6 mice were injected with pNFκβ-Luc plasmid (NFkBLuc) combined or not with plasmids expressing shαNotch1 (sh), U1inαNotch1 (U1in) or the combination of both. Luciferase activity was measured in living mice with a CCD camera at 4 days post-injection. Luciferase activity was quantified and plotted. The SI and the statistical significance are indicated.
Figure 2.
Figure 2.
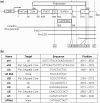
Schematic of the pCH-Fluc with the HBV genome expressing luciferase and the inhibitors that target HBV. (a) HBV genome was cloned after a CMV promoter. The boxes represent the ORFs for Pre-core and core, polymerase (pol), X protein and PreS1, S2 and surface (S) antigen, which has been replaced by Firefly luciferase. The numbers show the position of the nucleotides that mark the start and the stop of each ORF of HBV, starting at the ATG of Pre-core protein. The position where the luciferase sequence was inserted is also indicated. The last number indicates the position of the cleavage and polyadenylation. The parallel lines indicate the four HBV transcripts. All transcripts share the same polyadenylation sequences and therefore the polyA tail is initiated at the same position. Note that luciferase is probably translated from an RNA transcribed by the S promoter (PreS2 and S proteins). However the upstream PreS1 promoter should generate a longer RNA which may encode for a PreS1/Luciferase fusion protein that could show luciferase activity. The CMV promoter generates the longest RNA from which luciferase is unlikely to be translated. The position of the inhibitors is shown at the bottom of the figure. (b) List of inhibitors used in this study. Position and sequence of the target is also indicated.
Figure 3.
Figure 3.
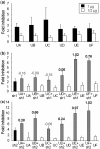
Analysis of U1ins targeting HBV in culture. (a) Expression inhibition of HBV sequences with U1i. Luciferase activity was measured in HuH7 cells co-transfected with pCH-FLuc and a control plasmid or 1 µg or 1/2 µg of each plasmid expressing U1inαHBV. (b and c) Effect of the co-expression of U1inαHBV and shRNAs αHBV on the expression from HBV sequences. Luciferase activity was measured as before but in cells co-transfected with pCH-FLuc and 1/2 µg of a plasmid expressing a control U1in, each U1inαHBV, sh1 (b), sh2 (c) or a combination of 1/2 µg of a plasmid expressing an U1inαHBV and 1/2 µg of a plasmid expressing sh1 (b) or sh2 (c). The FI is indicated for each case. Note that the scale is different for each figure. The SI is indicated at the top of the corresponding bars. Synergistic inhibitions are highlighted with an SI in bold. Data are mean ± SD from a minimum of five independent experiments.
Figure 4.
Figure 4.
Analysis of the inhibition of luciferase expression from HBV by RNAi and UA in mice. C57BL/6 mice were injected with pCH-Fluc plasmid (HBVLuc) combined or not with plasmids expressing UA, sh1, sh2 or the combination of UA and sh1 or UA and sh2. Luciferase activity was measured in living mice with a CCD camera at the indicated times post-injection (a–c) or in liver extracts obtained 8 days post-injection (d). Representative pictures are shown (a). The color scale used is identical for all images and is shown at the bottom. Luciferase activity was quantified and plotted (b) or used to calculate the FI and SI (c). RLU indicates relative light units (d). Data are mean ± SD from three independent experiments. Significant differences are indicated with asterisks. Note that in b significant differences shown compare luciferase activity obtained with the best inhibitor, either UA or shRNA, on its own with the luciferase activity obtained by combination of UA and the shRNA.
Figure 5.
Figure 5.
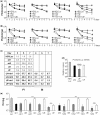
Effect of U1ins and shRNAs targeting HBV in mice. C57BL/6 mice were injected with pCH-Fluc plasmid (HBVLuc) combined or not with plasmids expressing UB, UD, UE, UF and/or sh1 (a, c and e) or sh2 (b–e). Luciferase activity was quantified in living mice with a CCD camera at the indicated times post-injection (a–c) or in liver extracts obtained 8 days post-injection (e). PreS2/S Luc mRNA was quantified by RT–PCR from the same extracts (d). The relative number of copies of PreS2/S Luc mRNA obtained from 67 ng of pA + mRNA compared to a standard plasmid is shown. FI was calculated as described (c). The SI has been calculated for the combination of U1in and shRNA (c and d). RLU indicates relative light units (e). Data are mean ± SD from at least two independent experiments. Significant differences are indicated with asterisks. Statistical analysis shown compares animals treated with the combination of U1in and shRNA with animals treated with the best inhibitor alone (a, b and d) or with either of the inhibitors on its own (e). Statistical analysis of UB, UD and UE resulted in non-significant differences.
Figure 6.
Figure 6.
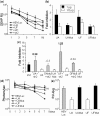
Analysis of the specificity of U1ins targeting HBV. (a) C57BL/6 mice were injected with pSEAP and pCH-Fluc plasmid (HBVLuc) combined or not with plasmids expressing UA, UF, sh1 or sh2. SEAP was quantified in blood extracted at the indicated times post-injection. SEAP RU indicates relative units of SEAP. (b and c) Luciferase activity was evaluated in HuH7 cells treated as described in Figure 3 with the exception that the cells were transfected with plasmids expressing inhibitors UA, UAMut, UF and UFMut alone (b) or in combination with sh1 or sh2 (c). Cells expressing sh1 or sh2 alone were also evaluated (c). The FI is indicated for each case. Note that the scale is different for each figure. The SI is indicated at the top of the corresponding bars. Synergistic inhibitions are highlighted with an SI in bold. (d and e) C57BL/6 mice were injected with pCH-Fluc plasmid (HBVLuc) combined or not with plasmids expressing UA, UAMut, UF and UFMut. Luciferase activity was quantified in living mice with a CCD camera at the indicated times post-injection (d) or in liver extracts obtained 8 days post-injection (e). RLU indicates relative light units. Data are mean ± SD from at least two independent experiments.
Figure 7.
Figure 7.
Effect of combining HBV inhibitors on luciferase expression in vivo. (a–d) Effect of increased doses of inhibitors. C57BL/6 mice were injected with pCH-Fluc plasmid (HBVLuc) combined with 10 or 20 µg (×2) of plasmids expressing sh1 (a), UA (b), UD (c) or UF (d). (e and f) Effect of combining inhibitors of the same kind. C57BL/6 mice were injected with pCH-Fluc plasmid (HBVLuc) combined with 10 µg of plasmids expressing sh1, sh2 or the combination of sh1 and sh2 (e) or UA, UF or the combination of UA and UF (f). Luciferase activity was quantified in living mice with a CCD camera at the indicated times post-injection. FI and SI were calculated as described. Data are mean ± SD from two independent experiments.
Figure 8.
Figure 8.
Quantification of shRNAs and U1in targeting HBV. (a) Quantification of shRNAs. sh1 and sh2-derived siRNAs were visualized by extension with a sh1 (lanes 1–10) or sh2-specific (lanes 11–20) labeled primer of RNAs isolated from the liver of C57BL/6 mice injected with pCH-Fluc plasmid (HBVLuc, lanes 2 and 12) alone or combined with 20 or 10 µg of plasmids expressing sh1 or sh2 or with 10 µg of plasmids expressing sh1 or sh2 and 10 µg of plasmids expressing UA or UF. U6 snRNA was also evaluated by primer extension as a loading control (bottom). Two shRNA-expressing animals were evaluated for each condition. Labeled primer incubated with buffer was run in parallel (Oligo). (b) Quantification of U1in in vitro and in vivo. Exogenous U1in expression was quantified by RT-PCR from liver extracts obtained as described in Figure 5 (b) or extracts from HuH7 cells transfected with plasmids expressing UD, UE or UF as described in Figure 3 (c). Actin mRNA was also quantified to allow comparison between different samples. Data are mean ± SD from five (a) or six (b) samples from two independent experiments.

Similar articles

Cited by

References

    1. Rivas FV, Tolia NH, Song JJ, Aragon JP, Liu J, Hannon GJ, Joshua-Tor L. Purified Argonaute2 and an siRNA form recombinant human RISC. Nat. Struct. Mol. Biol. 2005;12:340–349. - PubMed
    1. Abad X, Razquin N, Abad A, Fortes P. Combination of RNA interference and U1 inhibition leads to increased inhibition of gene expression. Nucleic Acids Res. 2010;38:e136. - PMC - PubMed
    1. Gunderson SI, Polycarpou-Schwarz M, Mattaj IW. U1 snRNP inhibits pre-mRNA polyadenylation through a direct interaction between U1 70K and poly(A) polymerase. Mol. Cell. 1998;1:255–264. - PubMed
    1. Beckley SA, Liu P, Stover ML, Gunderson SI, Lichtler AC, Rowe DW. Reduction of target gene expression by a modified U1 snRNA. Mol. Cell. Biol. 2001;21:2815–2825. - PMC - PubMed
    1. Fortes P, Cuevas Y, Guan F, Liu P, Pentlicky S, Jung SP, Martinez-Chantar ML, Prieto J, Rowe D, Gunderson SI. Inhibiting expression of specific genes in mammalian cells with 5' end-mutated U1 small nuclear RNAs targeted to terminal exons of pre-mRNA. Proc. Natl Acad. Sci. USA. 2003;100:8264–8269. - PMC - PubMed

Publication types