

doi: 10.1093/nar/gkr975.
Epub 2011 Nov 15.
IMG/M: the integrated metagenome data management and comparative analysis system
Affiliations
- PMID: 22086953
- PMCID: PMC3245048
- DOI: 10.1093/nar/gkr975
Item in Clipboard
IMG/M: the integrated metagenome data management and comparative analysis system
Nucleic Acids Res.
2012 Jan.
Abstract
The integrated microbial genomes and metagenomes (IMG/M) system provides support for comparative analysis of microbial community aggregate genomes (metagenomes) in a comprehensive integrated context. IMG/M integrates metagenome data sets with isolate microbial genomes from the IMG system. IMG/M's data content and analytical capabilities have been extended through regular updates since its first release in 2007. IMG/M is available at http://img.jgi.doe.gov/m. A companion IMG/M systems provide support for annotation and expert review of unpublished metagenomic data sets (IMG/M ER: http://img.jgi.doe.gov/mer).
Figures
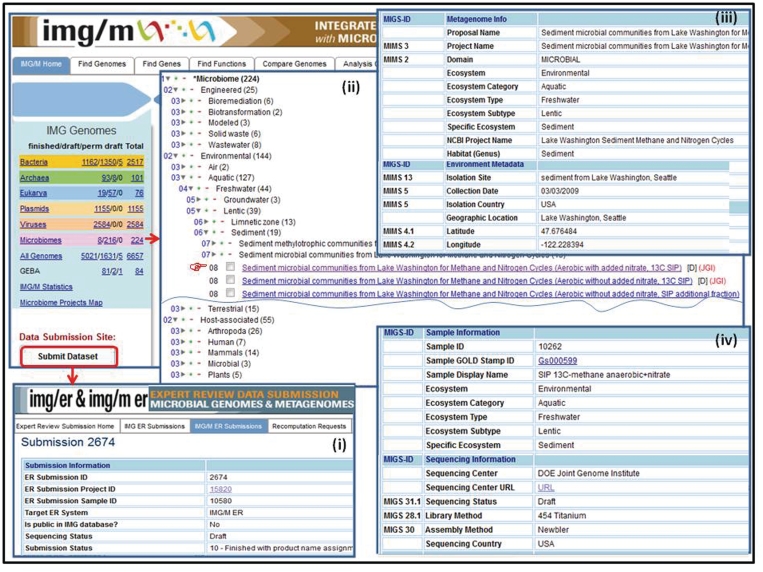
Metagenome data set classification and metadata characterization. (i) Metagenome data sets are submitted for annotation and inclusion into IMG/M ER via the IMG/ER and IMG/M ER submission site. (ii) Metagenome data sets in IMG/M are organized using a hierarchical classification similar to the phylogenetic classification of isolate genomes. (iii) Metagenome data sets submitted for inclusion into IMG/M ER are associated with metadata characterizing the metagenome study, the associated metagenome sequencing project, environmental information, as well as (iv) sample and sequencing information.
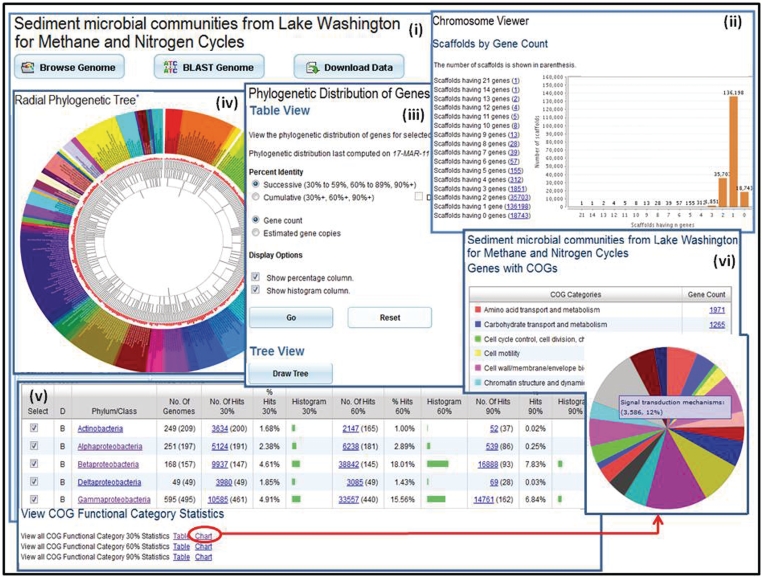
Metagenome data exploration. (i) Microbiome samples, such as the Sediment microbial communities from Lake Washington for Methane and Nitrogen Cycle sample, can be examined using the ‘Microbiome Details’ page, which provide tools for browsing, searching or downloading the metagenome data. (ii) ‘Scaffold Cart’ allows selecting individual scaffolds or groups of scaffolds based on properties such as gene content. (iii) The ‘Phylogenetic Distribution of Genes’ provides an estimate of the phylogenetic composition of a metagenome sample based on the distribution of the best BLAST hits of the protein-coding genes in the sample. The result of ‘Phylogenetic Distribution of Genes’ can be displayed using (iv) the ‘Radial Phylogenetic Tree’ viewer or (v) in a tabular format consisting of a histogram with counts protein-coding genes in the sample, which have best BLASTp hits to proteins of isolate genomes in each phylum or class with >90% identity (right column), 60–90% identity (middle column) and 30–60% identity (left column). (vi) The organization of genes by their assignment to COGs is displayed in a pie chart format.
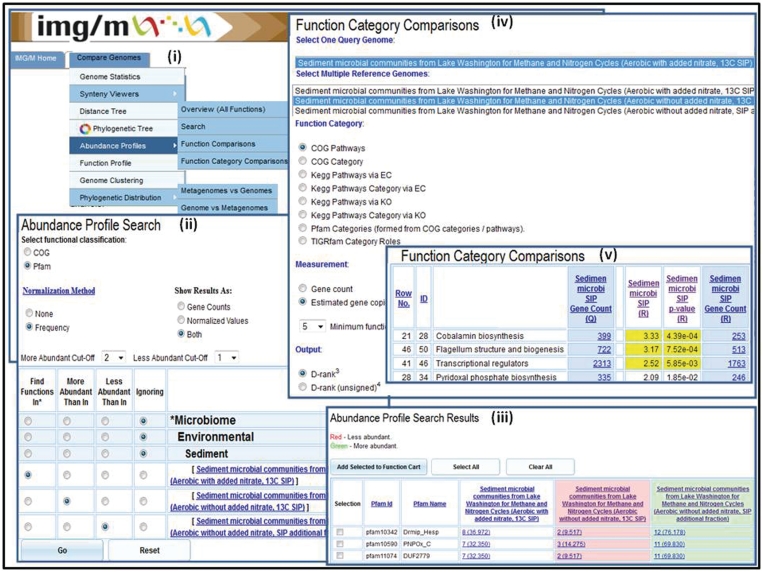
Abundance profile and function comparison tools. The ‘Abundance Profile Search’ allows finding protein families (COGs and Pfams) in metagenomes and isolate genomes based on their relative abundance, such as (ii) finding all Pfams in the Sediment microbial communities from Lake Washington (Aerobic with added nitrate, 13C SIP) sample, which are at least twice as abundant as in the Sediment microbial communities from Lake Washington (Aerobic without added nitrate, 13C SIP) sample and are at least twice less abundant than in Sediment microbial communities from Lake Washington (Aerobic without added nitrate, SIP additional fraction). (iii) The ‘Abundance Profile Search Results’ consists of a list of protein families that satisfy the search criteria together with the metagenomes or genomes involved in the comparison and their associated raw or normalized gene counts. (iv) The ‘Function Category Comparison’ tool allows comparing a metagenome data set with other metagenome data sets or reference genome data sets in terms of the relative abundance of functional categories (COG Pathway, KEGG Pathway, KEGG Pathway Category, Pfam Category and TIGRfam Role Categories). (v) The result of ‘Function Category Comparison’ lists for each function category, F, the number of genes and estimated gene copies in the target (query) metagenome associated with F and for each reference genome/metagenome the number of genes or estimated gene copies associated with F, as well as an assessment of statistical significance in terms of associated P-value and d-rank.
References
-
- Mavromatis K, Ivanova N, Barry K, Shapiro H, Goltsman E, McHardy AC, Rigoutsos I, Salamov A, Korzeniewski F, Land M, et al. On the fidelity of processing metagenomic sequences using simulated dataset. Nat. Methods. 2007;4:495–500. - PubMed
Publication types
MeSH terms
Grants and funding
LinkOut - more resources
Full Text Sources
Other Literature Sources
Miscellaneous
