

Do replication forks control late origin firing in Saccharomyces cerevisiae?
- PMID: 22086957
- PMCID: PMC3300028
- DOI: 10.1093/nar/gkr982
Do replication forks control late origin firing in Saccharomyces cerevisiae?
Abstract
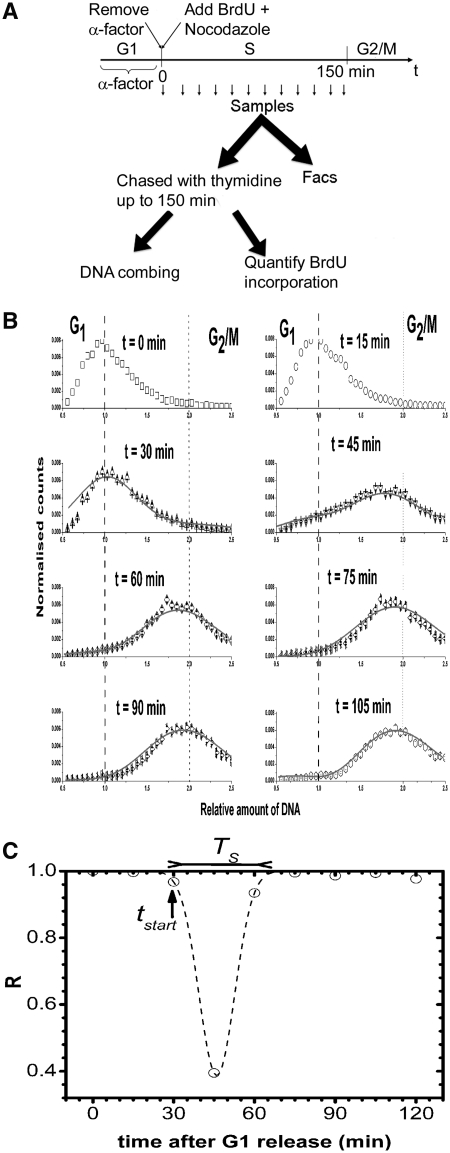
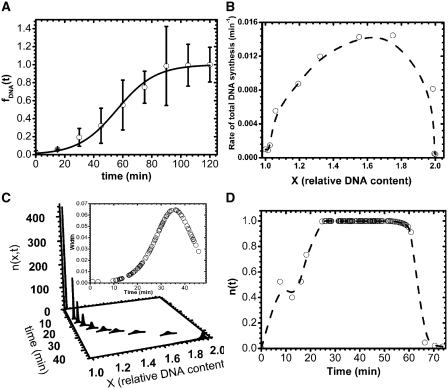
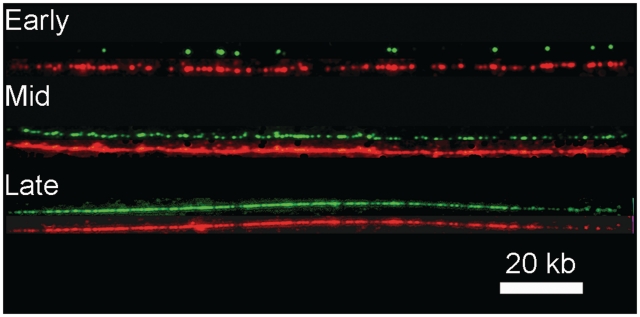
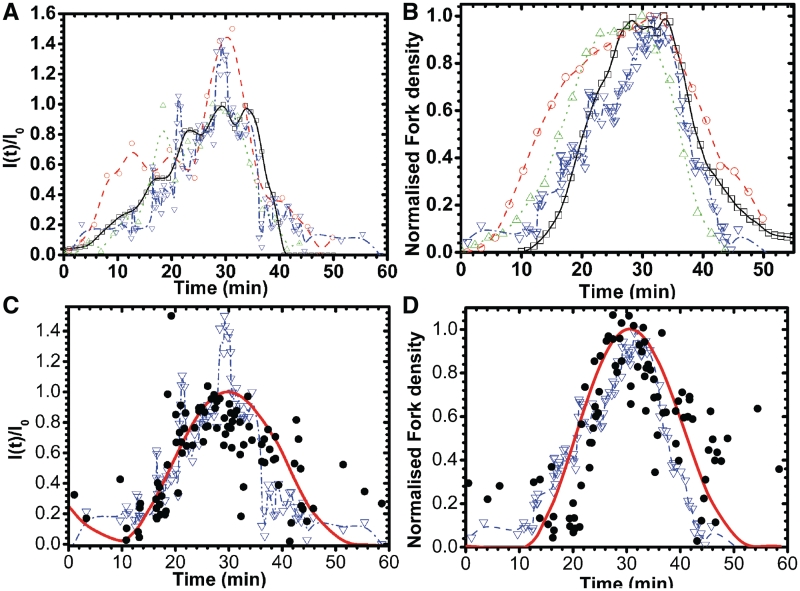
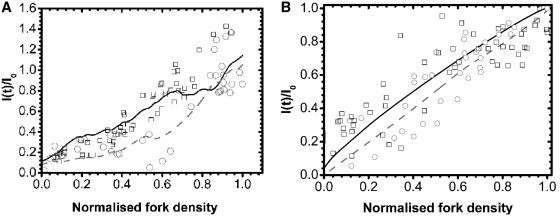
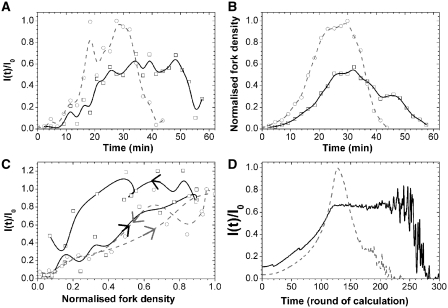
Recent studies of eukaryotic DNA replication timing profiles suggest that the time-dependent rate of origin firing, I(t), has a universal shape, which ensures a reproducible replication completion time. However, measurements of I(t) are based on population averages, which may bias the shape of the I(t) because of imperfect cell synchrony and cell-to-cell variability. Here, we measure the population-averaged I(t) profile from synchronized Saccharomyces cerevisiae cells using DNA combing and we extract the single-cell I(t) profile using numerical deconvolution. The single cell I(t) and the population-averaged I(t) extracted from DNA combing and replication timing profiles are similar, indicating a genome scale invariance of the replication process, and excluding cell-to-cell variability in replication time as an explanation for the shape of I(t). The single cell I(t) correlates with fork density in wild-type cells, which is specifically loosened in late S phase in the clb5Δ mutant. A previously proposed numerical model that reproduces the wild-type I(t) profile, could also describe the clb5Δ mutant I(t) once modified to incorporate the decline in CDK activity and the looser dependency of initiation on fork density in the absence of Clb5p. Overall, these results suggest that the replication forks emanating from early fired origins facilitate origin firing in later-replicating regions.
Figures
Similar articles
-
Behavior of replication origins in Eukaryota - spatio-temporal dynamics of licensing and firing.Cell Cycle. 2015;14(14):2251-64. doi: 10.1080/15384101.2015.1056421. Epub 2015 Jun 1. Cell Cycle. 2015. PMID: 26030591 Free PMC article. Review.
-
Diminished S-phase cyclin-dependent kinase function elicits vital Rad53-dependent checkpoint responses in Saccharomyces cerevisiae.Mol Cell Biol. 2004 Dec;24(23):10208-22. doi: 10.1128/MCB.24.23.10208-10222.2004. Mol Cell Biol. 2004. PMID: 15542831 Free PMC article.
-
A variable fork rate affects timing of origin firing and S phase dynamics in Saccharomyces cerevisiae.J Biotechnol. 2013 Oct 20;168(2):174-84. doi: 10.1016/j.jbiotec.2013.06.022. Epub 2013 Jul 9. J Biotechnol. 2013. PMID: 23850861
-
The temporal program of chromosome replication: genomewide replication in clb5{Delta} Saccharomyces cerevisiae.Genetics. 2008 Dec;180(4):1833-47. doi: 10.1534/genetics.108.094359. Epub 2008 Oct 1. Genetics. 2008. PMID: 18832352 Free PMC article.
-
Origin Firing Regulations to Control Genome Replication Timing.Genes (Basel). 2019 Mar 6;10(3):199. doi: 10.3390/genes10030199. Genes (Basel). 2019. PMID: 30845782 Free PMC article. Review.
Cited by
-
FORK-seq: replication landscape of the Saccharomyces cerevisiae genome by nanopore sequencing.Genome Biol. 2020 May 26;21(1):125. doi: 10.1186/s13059-020-02013-3. Genome Biol. 2020. PMID: 32456659 Free PMC article.
-
Evidence for sequential and increasing activation of replication origins along replication timing gradients in the human genome.PLoS Comput Biol. 2011 Dec;7(12):e1002322. doi: 10.1371/journal.pcbi.1002322. Epub 2011 Dec 29. PLoS Comput Biol. 2011. PMID: 22219720 Free PMC article.
-
Dual DNA replication modes: varying fork speeds and initiation rates within the spatial replication program in Xenopus.Nucleic Acids Res. 2025 Jan 24;53(3):gkaf007. doi: 10.1093/nar/gkaf007. Nucleic Acids Res. 2025. PMID: 39883014 Free PMC article.
-
Behavior of replication origins in Eukaryota - spatio-temporal dynamics of licensing and firing.Cell Cycle. 2015;14(14):2251-64. doi: 10.1080/15384101.2015.1056421. Epub 2015 Jun 1. Cell Cycle. 2015. PMID: 26030591 Free PMC article. Review.
-
Telomere-to-telomere DNA replication timing profiling using single-molecule sequencing with Nanotiming.Nat Commun. 2025 Jan 2;16(1):242. doi: 10.1038/s41467-024-55520-3. Nat Commun. 2025. PMID: 39747057 Free PMC article.
References
-
- Huberman JA, Riggs AD. On the mechanism of DNA replication in mammalian chromosomes. J. Mol. Biol. 1968;32:327–341. - PubMed
Publication types
MeSH terms
Substances
LinkOut - more resources
Full Text Sources
Molecular Biology Databases
