

Ethanol and reactive species increase basal sequence heterogeneity of hepatitis C virus and produce variants with reduced susceptibility to antivirals
- PMID: 22087316
- PMCID: PMC3210796
- DOI: 10.1371/journal.pone.0027436
Ethanol and reactive species increase basal sequence heterogeneity of hepatitis C virus and produce variants with reduced susceptibility to antivirals
Abstract
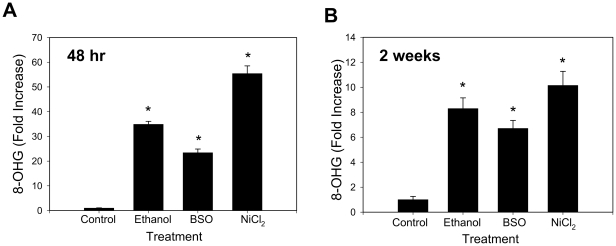
Hepatitis C virus (HCV) exhibits a high level of genetic variability, and variants with reduced susceptibility to antivirals can occur even before treatment begins. In addition, alcohol decreases efficacy of antiviral therapy and increases sequence heterogeneity of HCV RNA but how ethanol affects HCV sequence is unknown. Ethanol metabolism and HCV infection increase the level of reactive species that can alter cell metabolism, modify signaling, and potentially act as mutagen to the viral RNA. Therefore, we investigated whether ethanol and reactive species affected the basal sequence variability of HCV RNA in hepatocytes. Human hepatoma cells supporting a continuous replication of genotype 1b HCV RNA (Con1, AJ242652) were exposed to ethanol, acetaldehyde, hydrogen peroxide, or L-buthionine-S,R-sulfoximine (BSO) that decreases intracellular glutathione as seen in patients. Then, NS5A region was sequenced and compared with genotype 1b HCV sequences in the database. Ethanol and BSO elevated nucleotide and amino acid substitution rates of HCV RNA by 4-18 folds within 48 hrs which were accompanied by oxidative RNA damage. Iron chelator and glutathione ester decreased both RNA damage and mutation rates. Furthermore, infectious HCV and HCV core gene were sufficient to induce oxidative RNA damage even in the absence of ethanol or BSO. Interestingly, the dn/ds ratio and percentage of sites undergoing positive selection increased with ethanol and BSO, resulting in an increased detection of NS5A variants with reduced susceptibility to interferon alpha, cyclosporine, and ribavirin and others implicated in immune tolerance and modulation of viral replication. Therefore, alcohol is likely to synergize with virus-induced oxidative/nitrosative stress to modulate the basal mutation rate of HCV. Positive selection induced by alcohol and reactive species may contribute to antiviral resistance.
Conflict of interest statement
Figures
References
-
- Hofmann WP, Zeuzem S, Sarrazin C. Hepatitis C virus-related resistance mechanisms to interferon alpha-based antiviral therapy. J Clin Virol. 2005;32:86–91. - PubMed
-
- Pawlotsky JM. The nature of interferon-alpha resistance in hepatitis C virus infection. Curr Opin Infect Dis. 2003;16:587–592. - PubMed
-
- Halfon P, Locarnini S. Hepatitis C virus resistance to protease inhibitors. J Hepatol. 2007;55:192–206. - PubMed
-
- Zubkova I, Choi YH, Chang E, Pirollo K, Uren T, et al. T-cell vaccines that elicit effective immune responses against HCV in chimpanzees may create greater immune pressure for viral mutation. Vaccine. 2009;27:2594–2602. - PubMed
-
- Duan H, Struble E, Zhong L, Mihalik K, Major M, et al. Hepatitis C virus with a naturally occurring single amino-acid substitution in the E2 envelope protein escapes neutralization by naturally-induced and vaccine-induced antibodies. Vaccine. 2010;28:4138–4144. - PubMed
Publication types
MeSH terms
Substances
Grants and funding
LinkOut - more resources
Full Text Sources
