

A two-compartment model of VEGF distribution in the mouse
- PMID: 22087332
- PMCID: PMC3210788
- DOI: 10.1371/journal.pone.0027514
A two-compartment model of VEGF distribution in the mouse
Abstract
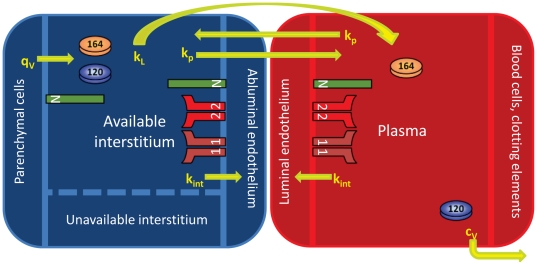
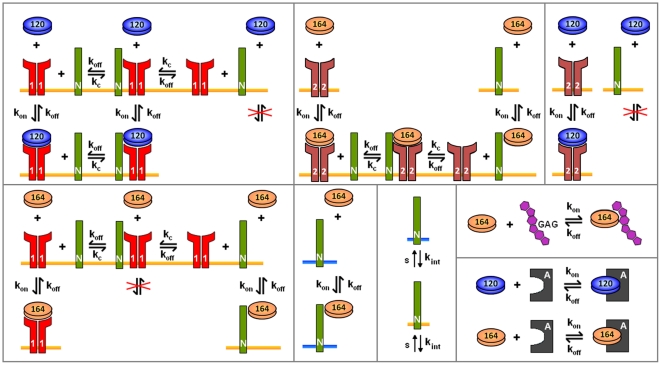
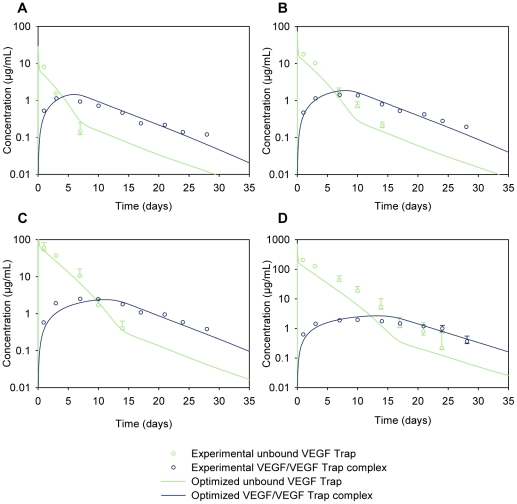
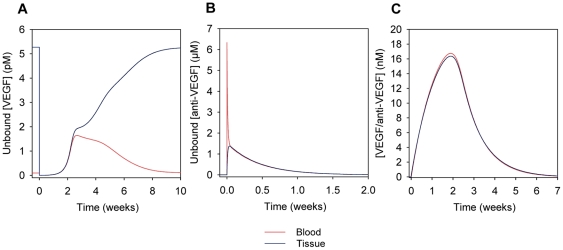
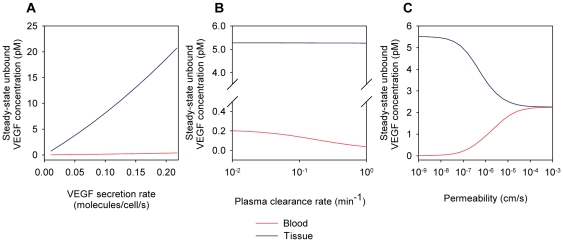
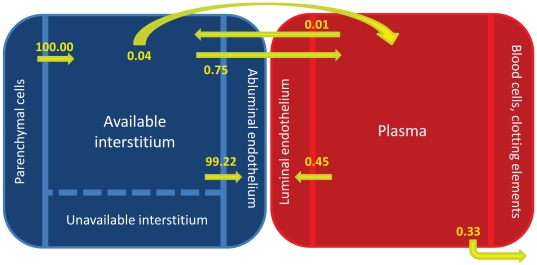
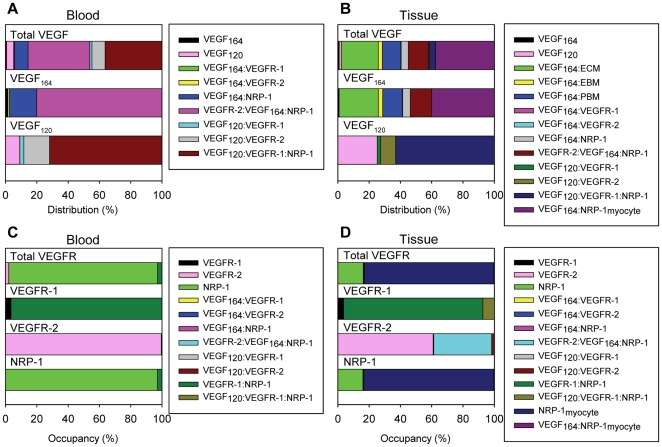
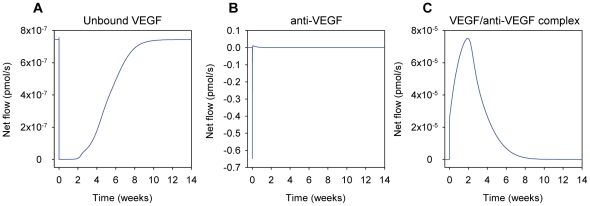
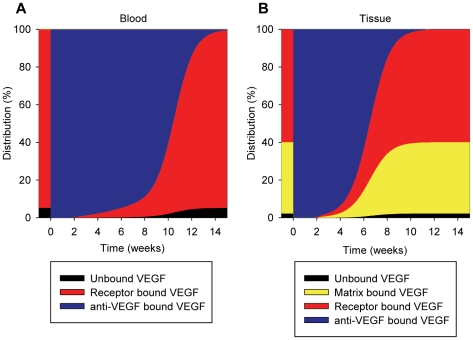
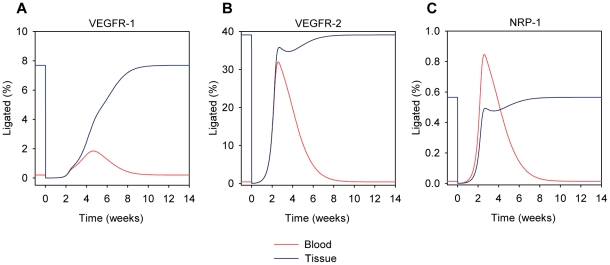
Vascular endothelial growth factor (VEGF) is a key regulator of angiogenesis--the growth of new microvessels from existing microvasculature. Angiogenesis is a complex process involving numerous molecular species, and to better understand it, a systems biology approach is necessary. In vivo preclinical experiments in the area of angiogenesis are typically performed in mouse models; this includes drug development targeting VEGF. Thus, to quantitatively interpret such experimental results, a computational model of VEGF distribution in the mouse can be beneficial. In this paper, we present an in silico model of VEGF distribution in mice, determine model parameters from existing experimental data, conduct sensitivity analysis, and test the validity of the model. The multiscale model is comprised of two compartments: blood and tissue. The model accounts for interactions between two major VEGF isoforms (VEGF(120) and VEGF(164)) and their endothelial cell receptors VEGFR-1, VEGFR-2, and co-receptor neuropilin-1. Neuropilin-1 is also expressed on the surface of parenchymal cells. The model includes transcapillary macromolecular permeability, lymphatic transport, and macromolecular plasma clearance. Simulations predict that the concentration of unbound VEGF in the tissue is approximately 50-fold greater than in the blood. These concentrations are highly dependent on the VEGF secretion rate. Parameter estimation was performed to fit the simulation results to available experimental data, and permitted the estimation of VEGF secretion rate in healthy tissue, which is difficult to measure experimentally. The model can provide quantitative interpretation of preclinical animal data and may be used in conjunction with experimental studies in the development of pro- and anti-angiogenic agents. The model approximates the normal tissue as skeletal muscle and includes endothelial cells to represent the vasculature. As the VEGF system becomes better characterized in other tissues and cell types, the model can be expanded to include additional compartments and vascular elements.
Conflict of interest statement
Figures

Similar articles
-
Interactions of VEGF isoforms with VEGFR-1, VEGFR-2, and neuropilin in vivo: a computational model of human skeletal muscle.Am J Physiol Heart Circ Physiol. 2007 Jan;292(1):H459-74. doi: 10.1152/ajpheart.00637.2006. Epub 2006 Sep 15. Am J Physiol Heart Circ Physiol. 2007. PMID: 16980341
-
A compartment model of VEGF distribution in blood, healthy and diseased tissues.BMC Syst Biol. 2008 Aug 19;2:77. doi: 10.1186/1752-0509-2-77. BMC Syst Biol. 2008. PMID: 18713470 Free PMC article.
-
A multiscale computational model predicts distribution of anti-angiogenic isoform VEGF165b in peripheral arterial disease in human and mouse.Sci Rep. 2016 Nov 17;6:37030. doi: 10.1038/srep37030. Sci Rep. 2016. PMID: 27853189 Free PMC article.
-
Intracranial meningiomas, the VEGF-A pathway, and peritumoral brain oedema.Dan Med J. 2013 Apr;60(4):B4626. Dan Med J. 2013. PMID: 23651727 Review.
-
Vascular endothelial growth factor (VEGF) - key factor in normal and pathological angiogenesis.Rom J Morphol Embryol. 2018;59(2):455-467. Rom J Morphol Embryol. 2018. PMID: 30173249 Review.
Cited by
-
Zymographic and ultrastructural evaluations after low-level laser irradiation on masseter muscle of HRS/J strain mice.Lasers Med Sci. 2013 May;28(3):777-83. doi: 10.1007/s10103-012-1156-6. Epub 2012 Jul 14. Lasers Med Sci. 2013. PMID: 22797825
-
A systems biology view of blood vessel growth and remodelling.J Cell Mol Med. 2014 Aug;18(8):1491-508. doi: 10.1111/jcmm.12164. Epub 2013 Nov 17. J Cell Mol Med. 2014. PMID: 24237862 Free PMC article. Review.
-
Monitoring Severity of Multiple Organ Dysfunction Syndrome: New Technologies.Pediatr Crit Care Med. 2017 Mar;18(3_suppl Suppl 1):S24-S31. doi: 10.1097/PCC.0000000000001050. Pediatr Crit Care Med. 2017. PMID: 28248831 Free PMC article. Review.
-
Mechanistic modeling quantifies the influence of tumor growth kinetics on the response to anti-angiogenic treatment.PLoS Comput Biol. 2017 Dec 21;13(12):e1005874. doi: 10.1371/journal.pcbi.1005874. eCollection 2017 Dec. PLoS Comput Biol. 2017. PMID: 29267273 Free PMC article.
-
Mitochondrial impairment, decreased sirtuin activity and protein acetylation in dorsal root ganglia in Friedreich Ataxia models.Cell Mol Life Sci. 2023 Dec 21;81(1):12. doi: 10.1007/s00018-023-05064-4. Cell Mol Life Sci. 2023. PMID: 38129330 Free PMC article.
References
-
- Leung DW, Cachianes G, Kuang WJ, Goeddel DV, Ferrara N. Vascular endothelial growth factor is a secreted angiogenic mitogen. Science. 1989;246:1306–1309. - PubMed
-
- Nakamura M, Abe Y, Tokunaga T. Pathological significance of vascular endothelial growth factor A isoform expression in human cancer. Pathol Int. 2002;52:331–339. - PubMed
-
- Roskoski R., Jr Vascular endothelial growth factor (VEGF) signaling in tumor progression. Crit Rev Oncol Hematol. 2007;62:179–213. - PubMed
-
- Ferrara N, Davis-Smyth T. The biology of vascular endothelial growth factor. Endocr Rev. 1997;18:4–25. - PubMed
-
- Ferrara N, Gerber HP, LeCouter J. The biology of VEGF and its receptors. Nat Med. 2003;9:669–676. - PubMed
Publication types
MeSH terms
Substances
Grants and funding
LinkOut - more resources
Full Text Sources
Research Materials
