

Evaluation of chronic lymphocytic leukemia by oligonucleotide-based microarray analysis uncovers novel aberrations not detected by FISH or cytogenetic analysis
- PMID: 22087757
- PMCID: PMC3253687
- DOI: 10.1186/1755-8166-4-25
Evaluation of chronic lymphocytic leukemia by oligonucleotide-based microarray analysis uncovers novel aberrations not detected by FISH or cytogenetic analysis
Abstract
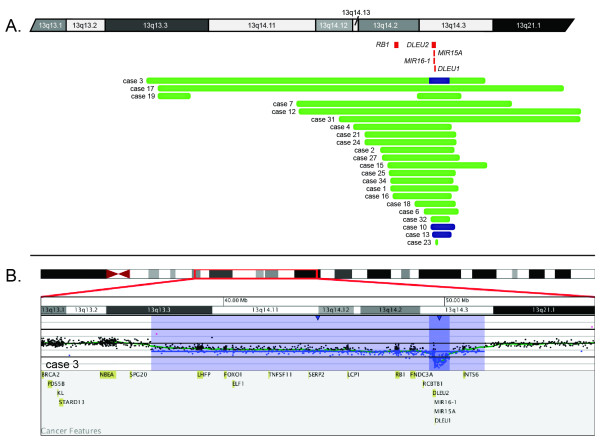
Background: Cytogenetic evaluation is a key component of the diagnosis and prognosis of chronic lymphocytic leukemia (CLL). We performed oligonucleotide-based comparative genomic hybridization microarray analysis on 34 samples with CLL and known abnormal karyotypes previously determined by cytogenetics and/or fluorescence in situ hybridization (FISH).
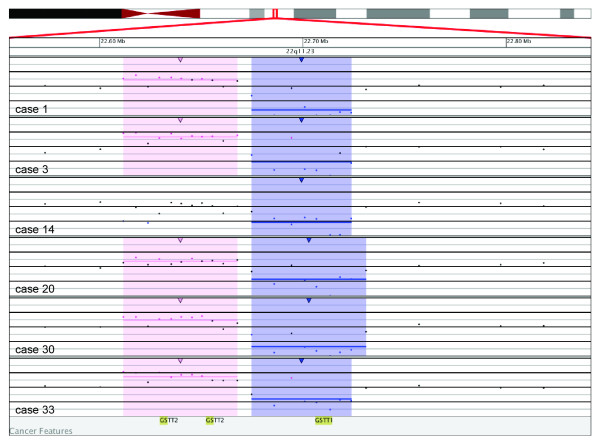
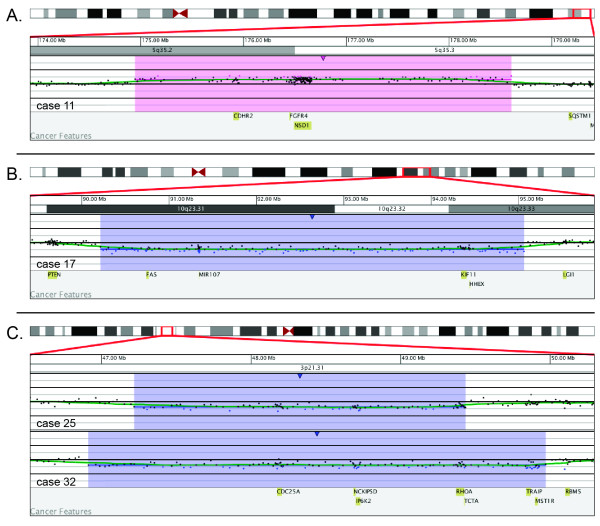
Results: Using a custom designed microarray that targets >1800 genes involved in hematologic disease and other malignancies, we identified additional cryptic aberrations and novel findings in 59% of cases. These included gains and losses of genes associated with cell cycle regulation, apoptosis and susceptibility loci on 3p21.31, 5q35.2q35.3, 10q23.31q23.33, 11q22.3, and 22q11.23.
Conclusions: Our results show that microarray analysis will detect known aberrations, including microscopic and cryptic alterations. In addition, novel genomic changes will be uncovered that may become important prognostic predictors or treatment targets for CLL in the future.
Figures
Similar articles
-
Evaluation of chronic lymphocytic leukemia by BAC-based microarray analysis.Mol Cytogenet. 2011 Feb 3;4(1):4. doi: 10.1186/1755-8166-4-4. Mol Cytogenet. 2011. PMID: 21291569 Free PMC article.
-
Clinical application of array-based comparative genomic hybridization for the identification of prognostically important genetic alterations in chronic lymphocytic leukemia.Mol Diagn Ther. 2008;12(5):271-80. doi: 10.1007/BF03256292. Mol Diagn Ther. 2008. PMID: 18803425 Review.
-
Genetic features of B-cell chronic lymphocytic leukemia.Rev Clin Exp Hematol. 2000 Mar;4(1):48-72. doi: 10.1046/j.1468-0734.2000.00003.x. Rev Clin Exp Hematol. 2000. PMID: 11486330 Review.
-
The value of fluorescence in situ hybridization in the diagnosis and prognosis of chronic lymphocytic leukemia.Cancer Genet Cytogenet. 2005 Apr 1;158(1):88-91. doi: 10.1016/j.cancergencyto.2004.08.012. Cancer Genet Cytogenet. 2005. PMID: 15771912
-
Evaluation of MLPA as a comprehensive molecular cytogenetic tool to detect cytogenetic markers of chronic lymphocytic leukemia in Egyptian patients.J Genet Eng Biotechnol. 2021 Jun 28;19(1):98. doi: 10.1186/s43141-021-00198-z. J Genet Eng Biotechnol. 2021. PMID: 34181122 Free PMC article.
Cited by
-
Characterization of a case of follicular lymphoma transformed into B-lymphoblastic leukemia.Mol Cytogenet. 2013 Aug 28;6(1):34. doi: 10.1186/1755-8166-6-34. Mol Cytogenet. 2013. PMID: 23985173 Free PMC article.
-
Detection of chromothripsis-like patterns with a custom array platform for chronic lymphocytic leukemia.Genes Chromosomes Cancer. 2015 Nov;54(11):668-80. doi: 10.1002/gcc.22277. Epub 2015 Aug 25. Genes Chromosomes Cancer. 2015. PMID: 26305789 Free PMC article.
-
Genomic arrays identify high-risk chronic lymphocytic leukemia with genomic complexity: a multi-center study.Haematologica. 2021 Jan 1;106(1):87-97. doi: 10.3324/haematol.2019.239947. Haematologica. 2021. PMID: 31974198 Free PMC article.
-
Chromosome banding analysis and genomic microarrays are both useful but not equivalent methods for genomic complexity risk stratification in chronic lymphocytic leukemia patients.Haematologica. 2022 Mar 1;107(3):593-603. doi: 10.3324/haematol.2020.274456. Haematologica. 2022. PMID: 33691382 Free PMC article.
References
-
- Higgins RA, Gunn SR, Robetorye RS. Clinical application of array-based comparative genomic hybridization for the identification of prognostically important genetic alterations in chronic lymphocytic leukemia. Mol Diagn Ther. 2008;12(5):271–280. - PubMed
-
- Rai KR, Sawitsky A, Cronkite EP, Chanana AD, Levy RN, Pasternack BS. Clinical staging of chronic lymphocytic leukemia. Blood. 1975;46(2):219–234. - PubMed
-
- Rai KR. In: Chronic lymphocytic leukemia: recent progress, future direction. Gale RP, Rai KR, editor. New York: Alan R. Liss; 1987. A critical analysis of staging in CLL; p. 253.
-
- Binet JL, Auquier A, Dighiero G, Chastang C, Piguet H, Goasguen J, Vaugier G, Potron G, Colona P, Oberling F, Thomas M, Tchernia G, Jacquillat C, Boivin P, Lesty C, Duault MT, Monconduit M, Belabbes S, Gremy F. A new prognostic classification of chronic lymphocytic leukemia derived from a multivariate survival analysis. Cancer. 1981;48(1):198–206. doi: 10.1002/1097-0142(19810701)48:1<198::AID-CNCR2820480131>3.0.CO;2-V. - DOI - PubMed
LinkOut - more resources
Full Text Sources
