. 2012 Jan 11;134(1):333-45.
doi: 10.1021/ja2073033. Epub 2011 Dec 21.

Dependence of avidity on linker length for a bivalent ligand-bivalent receptor model system

Affiliations

Dependence of avidity on linker length for a bivalent ligand-bivalent receptor model system

Eric T Mack et al. J Am Chem Soc. .

Abstract

This paper describes a synthetic dimer of carbonic anhydrase, and a series of bivalent sulfonamide ligands with different lengths (25 to 69 Å between the ends of the fully extended ligands), as a model system to use in examining the binding of bivalent antibodies to antigens. Assays based on analytical ultracentrifugation and fluorescence binding indicate that this system forms cyclic, noncovalent complexes with a stoichiometry of one bivalent ligand to one dimer. This dimer binds the series of bivalent ligands with low picomolar avidities (K(d)(avidity) = 3-40 pM). A structurally analogous monovalent ligand binds to one active site of the dimer with K(d)(mono) = 16 nM. The bivalent association is thus significantly stronger (K(d)(mono)/K(d)(avidity) ranging from ~500 to 5000 unitless) than the monovalent association. We infer from these results, and by comparison of these results to previous studies, that bivalency in antibodies can lead to associations much tighter than monovalent associations (although the observed bivalent association is much weaker than predicted from the simplest level of theory: predicted K(d)(avidity) of ~0.002 pM and K(d)(mono)/K(d)(avidity) ~ 8 × 10(6) unitless).


Figures

Figure 1
Figure 1
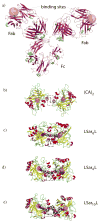
Crystal structures and molecular models of an IgG, and of (CA)2 with and without bivalent ligands. All structures are rendered at the same scale. a) X-ray crystal structure of a monoclonal murine IgG1 specific for phenolbarbital depicted as a multi-colored ribbon diagram (the ribbon diagram was generated using PyMol and the atomic coordinates: PDB 1IGY). b) X-ray crystal structure of (CA2) with the Zn2+ ions of the active site rendered as magenta spheres. The ethylene-glycol (EG) cross-linker joining the two monomers of CA is illustrated as atom colored sticks and outlined with a rectangle with dashed lines. c) Molecular model—not an X-ray crystal structure—of (CA)2 with LSar0L docked in the active sites of (CA)2, to show a possible geometry for a bridging ligand. The bivalent ligand LSar0L is rendered as atom colored spheres. The structure of the protein is based on the X-ray crystal structure. Details on the construction of the model are included in the Experimental section. d) Molecular model of (CA)2 with LSar4L docked in the active sites. e) Molecular model of (CA)2 with LSar10L docked in the active sites.
Figure 2
Figure 2
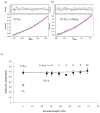
Sedimentation equilibrium experiments of CA and (CA)2 with and without added bivalent ligand as observed at 280 nm and 25 °C. a) The hollow circles are experimental data for 925 nM (CA)2 without added LRL, and the line is the fit for a single ideal species. The molecular weight estimated by non-linear curve fitting of the data is 58 ± 4 kDa and the molecular weight (MW) determined by ESI-MS was 58.385 kDa. b) The hollow circles are experimental data for 925 nM (CA)2 with 1 μM LSar4L. The molecular weight estimated from non-linear curve fitting of the data is 54 ± 1 kDa. c) Plot of the estimated values of MW as determined from sedimentation equilibrium experiments, as a function of the maximum distance between the two nitrogen atoms of the sulfonamide functional groups of the bivalent ligand (Γ is the extended length). The solid circles correspond to the best-fit values for MW calculated from non-linear curve fitting of the data, and the error bars correspond to the 95% confidence intervals from the non-linear fit. The solid black line corresponds to the MW obtained from adding the molecular weight of (CA)2 to that of the ligand. These data are summarized in Table S1 and data included in the Supporting Information.
Figure 3
Figure 3
Change in fluorescence (λex = 280 nm, λem = 340 nm) as benzenesulfonamide ligands dissociate from the active sites of (CA)2 (16.7 nM) and are replaced by ethoxzolamide (ethox, Kd = 0.2 nM) which quenches the fluorescence of (CA)2. a) This plot shows the three phases of kinetic assay: i) Equilibration of the solution of (CA)2 and ligand in buffer. ii) Addition of a solution of ethoxzolamide to the stirred solution of (CA)2 is accompanied by a reduction in fluorescence due to the inner filter effect. The mixing is complete in ~10 sec. iii) The fluorescence decreases as the ligand dissociates from the active sites of (CA)2 and is replaced by ethoxzolamide. Inset: The change in fluorescence as a solution of (CA)2 (16.7 nM) is equilibrated then a solution of ethoxzolamide (100 nM, Kd = 0.2 nM) is added. b) Stacked plot of the normalized fluorescence (λex = 280 nm, λem = 340 nm) of a solution of (CA)2 (16.7 nM) and L (160 nM) when ethoxzolamide (5, 10, and 15 μM) is added. These data are corrected for the inner-filter effect and normalized. c) Stacked plot of the normalized fluorescence of a solution of (CA)2 (16.7 nM) and LEG3L (160 nM) when ethoxzolamide (5, 10, and 15 μM) is added. d) Normalized fluorescence of a solution of (CA)2 (16.7 nM) and LSar4L (160 nM) when ethoxzolamide (6.25, 12.5, 25, 50, and 100 μM) is added. The solid shapes represent the data and the solid lines are an aid to the eye.
Figure 4
Figure 4
Titration of (CA)2 with monovalent benzenesulfonamide L and bivalent benzenesulfonamide ligands LRL. (CA)2 (25 nM) was equilibrated with 5 μM dansylamide 2 in 20 mM sodium phosphate buffer (pH 7.4) and different amounts of L or LRL. The fluorescence of the solution was monitored with a plate reader (λex = 290 nm, λem = 460 nm). The temperature was maintained at 25 °C. Each datum represents the average of three independent experiments, and the error bars represent the 90% confidence interval according to t-statistics. The error bars have been removed from several sets of data for clarity but are similar to those shown. The solid lines represent the best-fit line as determined from non-linear curve-fitting of eq S21 to each set of data (Supporting Information).
Figure 5
Figure 5
Thermodynamic scheme and simulations describing the model used to analyze the fluorescence titration experiments. a) The thermodynamic scheme comprises three equilibria characterized by three equilibrium constants (K1, K2, and K3) and four species that contain a dimer of CA (i.e., (CA)2·(DNSA)2, (CA)2·LRL·DNSA, (CA)2·LRLcyc, and (CA)2· (LRL)2). b) Simulation of the normalized concentrations of species obtained from titrating a solution of (CA)2 (25 nM) and dansylamide (DNSA, 5 μM) with different concentrations of LSar4L (Kdintra = 0.0007 unitless). The concentration of the cyclic species (CA)2·LRLcyc increases until a maximum is reached, as the total concentration of LSar4L is increased (from left to right). The concentration of (CA)2·LRLcyc then decreases as the concentration of unbound LSar4L is increased, which competes for the active sites of LSar4L. c) Simulation of the normalized concentrations of species obtained from titrating a solution of (CA)2 (25 nM) and dansylamide (5 μM) with LSar10L (Kdintra = 0.0096 unitless).
Figure 6
Figure 6
Plot of ΔG°inter and ΔG°avidity for the binding of monovalent (L) and bivalent benzenesulfonamide ligands (LRL) to a synthetic dimer of CA (CA)2 as a function of the extended length of the linker (Γ, Å). The monovalent ligand L does not have an extended length (Γ undefined), but it is included for comparison. The hollow circles are values of ΔG°inter (axis on the left side) and represent the ligands (L and LEG3L), which do not bind bivalently to (CA)2. The solid circles are values of ΔG°avidity (axis on the right side) and represent the series of bivalent ligands (LSarnL), which bind bivalently to (CA)2. The labels correspond to the number of sarcosines units (n) in the linker. All values are the average of three or more independent experiments and the errors bars correspond to 90% confidence intervals according to t-statistics.
Scheme 1
Scheme 1
Thermodynamic schemes describing the binding of monovalent ligands (L) to monovalent carbonic anhydrase CA and bivalent benzensulfonamide ligands (LRL) to a synthetic dimer of carbonic anhydrase (CA)2. a) The binding of CA to a monovalent ligand in solution (L) forms a receptor-ligand complex (CA·L) that is characterized by the dissociation constant Kdmono. b) The binding of a ligand covalently attached to CA by a flexible tether to the binding site is characterized by the unitless dissociation constant Kdintra. c) The association of (CA)2 to two ligands (L*) on a surface can be conceptualized as a process involving two steps. The initial step—the association of (CA)2 to L*—is characterized by dissociation constant Kdsurf. The second step—the association of an additional ligand to the unbound active site of (CA)2 forms a complex consisting of one (CA)2 and two ligands (L*· (CA)2·L*)—is characterized by dissociation constants Kdsurf. The avidity (Kdavidity surf) characterizes the strength of (CA)2 binding to L* in the form of L*· (CA)2·L*. d) The association of a bivalent ligand (LRL) to a dimer of CA (CA2) can be conceptualized as a process involving two steps. The initial step—the association of one binding moiety of LRL to one binding site of CA2 to form the “open” complex (CA)2·LRLlin —is characterized by the intermolecular dissociation constant ¼ Kdinter. The second step—the intramolecular association of the unoccupied binding site of (CA)2·LRLlin to the second binding moiety of LRL to form the cyclic complex (CA)2·LRLcyc—is characterized by the intramolecular dissociation constant 2 Kdintra. The overall strength of binding between (CA)2 and LRL is characterized by Kdavidity.
Scheme 2
Scheme 2
Kinetic scheme describing the dissociation of a bivalent ligand (LRL) from (CA)2 in the presence of ethoxzolamide (◀).
Chart 1
Chart 1

References

    1. Murphy K, Travers P, Walport M. Janeway’s Immunobiology. 7. Garland Science, Taylor & Francis Group, LLC; New York and London: 2008.
    1. Houk KN, Leach AG, Kim SP, Zhang XY. Angew Chem, Int Ed Eng. 2003;42:4872. - PubMed
    1. Mack ET, Snyder PW, Perez-Castillejos R, Whitesides GM. J Am Chem Soc. 2011;133:11701. - PMC - PubMed
    1. Gestwicki JE, Cairo CW, Strong LE, Oetjen KA, Kiessling LL. J Am Chem Soc. 2002;124:14922. - PubMed
    1. Mourez M, Collier RJ. Use of Phage Display and Polyvalency to Design Inhibitors of Protein-Protein Interactions. Vol. 261 Humana Press Inc; Totowa, NJ: 2004. - PubMed

Publication types