Review
. 2011 Dec;40(12):1339-55.
doi: 10.1007/s00249-011-0754-8. Epub 2011 Nov 17.

Understanding biomolecular motion, recognition, and allostery by use of conformational ensembles

Affiliations
Review

Understanding biomolecular motion, recognition, and allostery by use of conformational ensembles

R Bryn Fenwick et al. Eur Biophys J. 2011 Dec.

Abstract

We review the role conformational ensembles can play in the analysis of biomolecular dynamics, molecular recognition, and allostery. We introduce currently available methods for generating ensembles of biomolecules and illustrate their application with relevant examples from the literature. We show how, for binding, conformational ensembles provide a way of distinguishing the competing models of induced fit and conformational selection. For allostery we review the classic models and show how conformational ensembles can play a role in unravelling the intricate pathways of communication that enable allostery to occur. Finally, we discuss the limitations of conformational ensembles and highlight some potential applications for the future.


Figures

Fig. 1
Fig. 1
Structures and ensembles of ubiquitin showing the ability of ensemble approaches to capture structural heterogeneity. 1UBQ and 1D3Z are the X-ray crystallography structure and the NMR average solution structure (purple and red), respectively. In green are two ensembles of motion on the sub-τ c timescale (<~4 ns for ubiquitin) and in blue are two ensembles that capture supra-τ c timescales up to ms. Below the structures is the agreement, in Hz, with experimental hydrogen bond scalar couplings that are sensitive to a molecule’s motion (small numbers are better), formula image a measure of structural heterogeneity, and the RMSD from the X-ray crystal structure
Fig. 2
Fig. 2
Timescales of biological motion (above) and experimental and theoretical methods (below). Protein and nucleic acid dynamic timescales are shown in green and red, respectively. Timescales common to all biomolecules are shown in black. Experimental methods like small-angle X-ray scattering (SAXS) and wide-angle X-ray scattering (WAXS) are shown over the range they can detect fluctuations. Motion on faster timescales averages during the experiments
Fig. 3
Fig. 3
Dynamic content of BPTI from a 1 ms simulation run by D. E. Shaw Research, showing that motion of side chains is pronounced on the sub-τ c timescale and that backbone motion is significant on the supra-τ c timescale. Taken from Shaw et al. (2010)
Fig. 4
Fig. 4
Atomistic MD unrestrained and restrained schemes. For the restrained simulations, averaging of the experimental data is indicated as dashed lines. For unrestrained simulations, no restraints are present and the final ensemble is the sum of all frames (a). In MD selection no restraints are applied during the simulation, the final ensemble is selected on the basis of experimental data, eliminating structures that reduce the fit with experimental data (b). Restrained MD enforces the experimental data at each time point and, as a result, each structure is considered a different model of the average structure (c). During time-averaged restrained MD (d) a memory function biases the simulation to fulfil the restrained data over a given time period, the final ensemble samples the timescale up to the length of the memory function. Ensemble-averaged restrained MD restrains the experimental data at each step as in restrained MD, however the average runs over multiple parallel molecules that react to fulfil the experimental data at each time point over the ensemble (e). The final ensemble is a single snapshot of the parallel trajectories, and the timescale of the average is limited only by the timescale of the experimental data
Fig. 5
Fig. 5
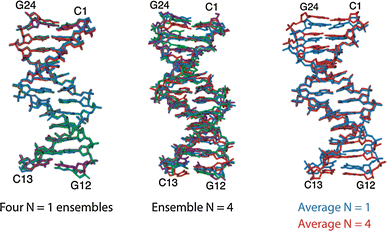
Dickerson DNA restrained MD simulations (N = 1) and ensemble restrained MD simulations (N = 4). The four N = 1 ensembles show that the average structure of the DNA is well defined by the experimental data, whereas the ensemble of N = 4 shows that the data are consistent with motion to some extent. The average representations of the two ensembles, shown on the right, indicate that the two ensembles lead to noticeably different average structures. Taken from Schwieters and Clore (2007)
Fig. 6
Fig. 6
Conformational selection and induced fit models of binding. The two different models are distinguished by the conformation of the binding site when the ligand binds. During conformational selection the ligand binds to the bound configuration of the binding site whereas during induced fit the bound form of the complex is formed after binding of the ligand
Fig. 7
Fig. 7
Conformational selection and induced fit ensembles. Conformational selection for ubiquitin where the bound and unbound conformations share large overlap (yellow and red) and induced fit for TIS11d where there is very little overlap of the distributions (green and blue). Data for ubiquitin adapted from Qin et al. (2009). Ubiquitin data taken from Fenwick et al. (2011) and MoDEL (Meyer et al. 2010). The distributions of pairwise RMSD to the average bound structure are scaled to have the same volume
Fig. 8
Fig. 8
Models of allostery. The schemes represent the identity of the conformations of a tetrameric (a) and heterodimer (b) allosteric protein that are present in solution as the concentration of ligand is increased from top to bottom. Ligand binding is represented as a change in color in the subunit from white to black whereas conformational change is represented by a change in shape; the populations of the various conformations are not represented. In the MWC model the species in solution do not change but their populations shift as a consequence of ligand binding; as only two possible states are possible there is a strong correlation between the conformation of each subunit. In the KNF model, instead, ligand binding causes a local conformational change in the subunit, that influences the affinity of the other subunits for the ligand without the need to invoke structural changes; as the conformational changes in the various binding sites are not concerted this model requires a weaker correlation between the conformations of each subunit. The general scheme of Eigen, where a full permutation of the states is considered, is also shown (right)
Fig. 9
Fig. 9
The scheme represents the conformational states that are populated to a non-negligible extent in the free state, in the intermediate state proposed by the KNF model and in the bound state. It can be seen that an accurate characterization of the structural heterogeneity of the free and bound states in terms of a conformational ensemble can provide information on the model that applies to a specific allosteric protein. The size of the symbols indicates which are the major and minor states
Fig. 10
Fig. 10
Correlations in dihedral and Cartesian space for the ERNST ensemble (Fenwick et al. 2011). Top left, the structure of ubiquitin, indicating the organisation of the β-strands and the degree of long-range structural correlation (red indicates high correlation, green no correlation). Top right, the Cα distance matrix of ubiquitin indicates which residues are close in space. Results are shown from correlation analysis for a conformational ensemble of ubiquitin in Cartesian space (bottom left) and in dihedral space (bottom right). Short-range correlations are indicated with green dashed lines, and long-range correlations with red dashed circles
Fig. 11
Fig. 11
TAR RNA biased transitions. a The three TAR dynamic conformers (green) and the TAR conformation (grey) bound to peptide derivatives of Tat and different small molecules. Shown on each 2D plane is the correlation coefficient (R) between angles for the ligand-bound conformations. b Comparison of the three TAR dynamic conformers (green) and ligand-bound TAR conformations (grey). Sub-conformers along the linear pathway linking conformers are shown in light green, and the direction of the trajectory is shown with arrows. Left panel, horizontal view after superposition of HI; middle and right panels, vertical view down and up the helix axis of HI and HII after superposition of HI and HII, respectively. Taken from Zhang et al. (2007)
Fig. 12
Fig. 12
Long-range correlations in a conformational ensemble of ubiquitin that create a channel between the two loops involved in molecular recognition. a Circular correlation coefficients (ρ) of φ and ψ of residues that are part of the surface patch of ubiquitin involved in binding to ubiquitin binding domains. b Representation of the corresponding β-strands showing the dihedral angles that sense the channel. c Correlation between φ i and ψ j of residues that are part of the network. Long-range correlations involving distant residues are indicated by red dashed circles (a, c). Taken from Fenwick et al. (2011)

Similar articles

Cited by

References

    1. Agarwal PK, Billeter SR, Rajagopalan PT, Benkovic SJ, Hammes-Schiffer S. Network of coupled promoting motions in enzyme catalysis. Proc Natl Acad Sci USA. 2002;99:2794–2799. doi: 10.1073/pnas.052005999. - DOI - PMC - PubMed
    1. Aleksandrov A, Simonson T. Molecular dynamics simulations show that conformational selection governs the binding preferences of imatinib for several tyrosine kinases. J Biol Chem. 2010;285:13807–13815. doi: 10.1074/jbc.M110.109660. - DOI - PMC - PubMed
    1. Allerhand A, Doddrell D, Glushko V, Cochran DW, Wenkert E, Lawson PJ, Gurd FR. Conformation and segmental motion of native and denatured ribonuclease A in solution. Application of natural-abundance carbon-13 partially relaxed Fourier transform nuclear magnetic resonance. J Am Chem Soc. 1971;93:544–546. doi: 10.1021/ja00731a053. - DOI - PubMed
    1. Allison JR, van Gunsteren WF. A method to explore protein side chain conformational variability using experimental data. Chemphyschem. 2009;10:3213–3228. doi: 10.1002/cphc.200900400. - DOI - PubMed
    1. Arora K, Brooks CL. Large-scale allosteric conformational transitions of adenylate kinase appear to involve a population-shift mechanism. Proc Natl Acad Sci USA. 2007;104:18496–18501. doi: 10.1073/pnas.0706443104. - DOI - PMC - PubMed

LinkOut - more resources