. 2012 Oct;22(10):2375-91.
doi: 10.1093/cercor/bhr317. Epub 2011 Nov 16.

Cell type-specific three-dimensional structure of thalamocortical circuits in a column of rat vibrissal cortex

Affiliations

Cell type-specific three-dimensional structure of thalamocortical circuits in a column of rat vibrissal cortex

Marcel Oberlaender et al. Cereb Cortex. 2012 Oct.

Abstract

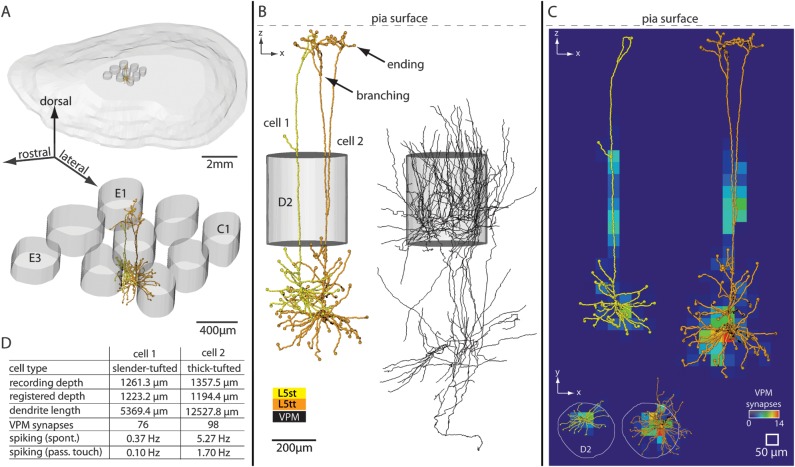
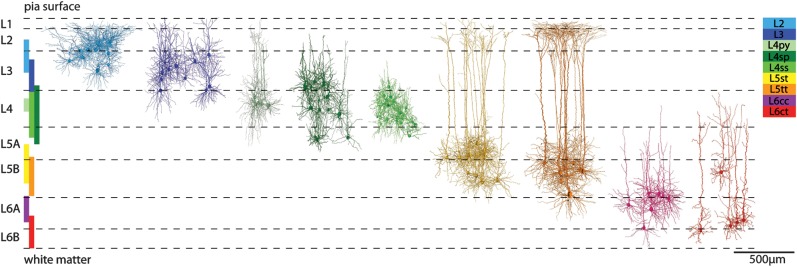
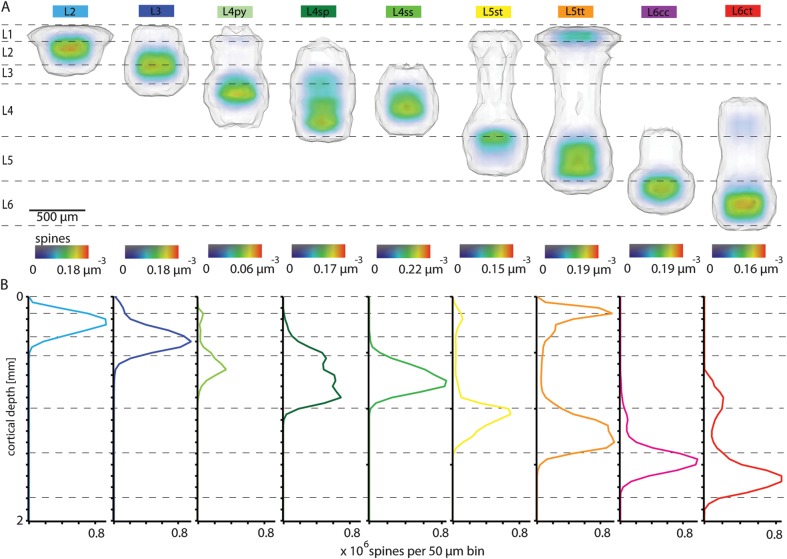
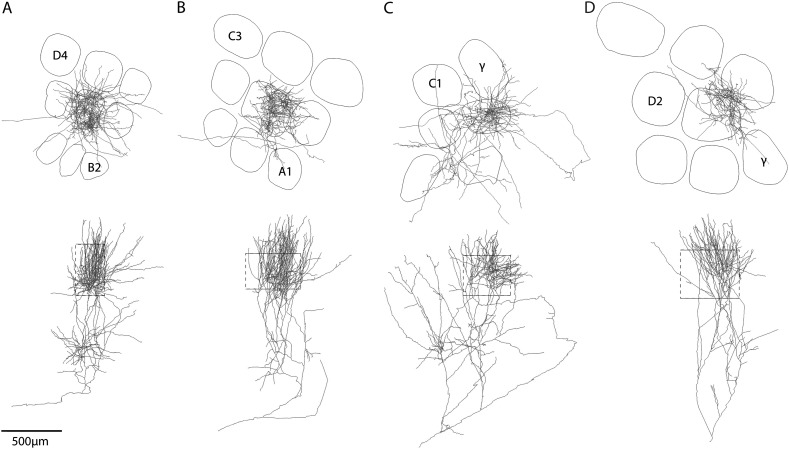
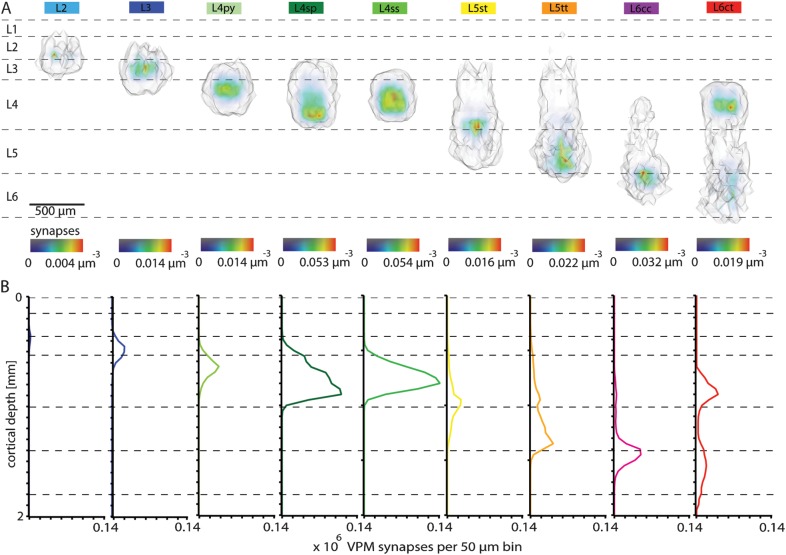
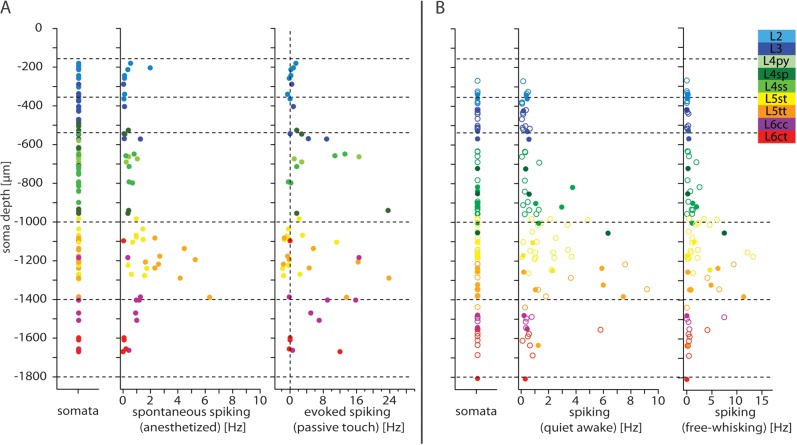
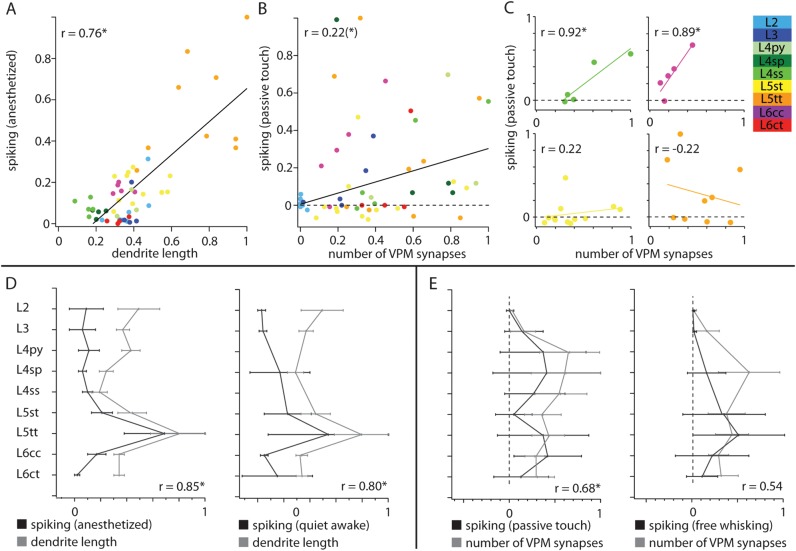
Soma location, dendrite morphology, and synaptic innervation may represent key determinants of functional responses of individual neurons, such as sensory-evoked spiking. Here, we reconstruct the 3D circuits formed by thalamocortical afferents from the lemniscal pathway and excitatory neurons of an anatomically defined cortical column in rat vibrissal cortex. We objectively classify 9 cortical cell types and estimate the number and distribution of their somata, dendrites, and thalamocortical synapses. Somata and dendrites of most cell types intermingle, while thalamocortical connectivity depends strongly upon the cell type and the 3D soma location of the postsynaptic neuron. Correlating dendrite morphology and thalamocortical connectivity to functional responses revealed that the lemniscal afferents can account for some of the cell type- and location-specific subthreshold and spiking responses after passive whisker touch (e.g., in layer 4, but not for other cell types, e.g., in layer 5). Our data provides a quantitative 3D prediction of the cell type-specific lemniscal synaptic wiring diagram and elucidates structure-function relationships of this physiologically relevant pathway at single-cell resolution.


Figures

Figure 1.
Figure 1.
Three-dimensional reconstruction and registration of in vivo-labeled dendrite and axon morphologies in a rat barrel column. (A) Upper panel: 3D view of pia surface and 9 L4 barrels. Lower panel: Blow up of the 9 barrels. The central barrel contains registered 3D soma–dendrite reconstructions. (B) Semicoronal view of registered neurons. Two excitatory neurons of different cell types are located at the same cortical depth (left) and are innervated by thalamocortical axons from VPM (right). (C) Structural overlap between registered dendrite and VPM axon morphologies allows determining 3D subcellular innervation of thalamocortical synapses. (D) This method of reconstruction and registration allows determining the cell type, anatomical parameters, synaptic innervation, and spiking activity in vivo (spontaneous and evoked by passive whisker touch) for individual neurons. This is illustrated for one example of 2 L5 pyramidal neurons shown in panels AC.
Figure 2.
Figure 2.
Definition of excitatory cell types in a barrel column. Cluster analysis of morphological features identified 9 excitatory cell types. Registration allowed determining the vertical extent of the cell type–specific soma locations (colored vertical bars). These cell-type borders were not sharp and complement cytoarchitectonic definitions of cortical layers (e.g., using soma density as indicated by the horizontal dashed lines; adopted from Meyer, Wimmer, Oberlaender, et al. (2010). Some of the cell-type borders determined here did not match cytoarchitectonic layer borders (e.g., L4 neurons may be located in cytoarchitectonic layers 3 and 5) and some cell types intermingled within layers (e.g., thick-tufted and slender-tufted neurons in L5).
Figure 3.
Figure 3.
Three-dimensional reconstruction of thalamocortical circuits between VPM and excitatory neurons in a barrel column. (A) Semicoronal (upper panel) and tangential (lower panel) view of the 3D cell type–specific network of excitatory neuron somata in a barrel column (dashed box: dimensions of the soma column). Three-dimensional soma locations of various cell types intermingle within cytoarchitectonic layers (note that neurons in L1 are not shown). (B) The 3D density distribution of all excitatory neuron somata is superimposed with the 1D density profile along the vertical column axis. (C) 3D cell type–specific network of dendrites of excitatory neurons. The gray volume refers to the 3D envelop surrounding the dendrites from all neurons located within the soma column (i.e., dendrite column). (D) The dendrite network is converted into a 3D spine distribution, which is also shown as the 1D spine density profile along the vertical column axis. (E) Superposition of individual intracortical 3D patterns of VPM axons (n = 12) in semicoronal and tangential view. (F) The VPM axon network is extrapolated to one barreloid and converted into a 3D bouton distribution, which is also shown as a 1D profile along the vertical column axis. Dashed horizontal lines represent cell type–derived layer borders as shown in Fig. 1.
Figure 4.
Figure 4.
Cell type–specific 3D dendrite–spine distributions within a barrel column. (A) Semicoronal view of cell type–specific 3D dendrite–spine densities and innervation volumes for the 9 excitatory cell types. (B) Cell type–specific 1D spine density profiles along the vertical column axis.
Figure 5.
Figure 5.
Three-dimensional reconstructions of individual thalamocortical axons in a barrel column. Examples of complete intracortical 3D axon projection patterns of individual VPM neurons. Based on differences in subcellular 3D innervation patterns, we classified 4 different neuron types in a VPM barreloid. (A) VPM-core. (B) VPM-subbarrel core. (C) VPM-core/tail. (D) VPM-head. The naming convention was adopted from previous reports that related the projection pattern to the soma location within the barreloid (see Results).
Figure 6.
Figure 6.
Cell type–specific 3D VPM synapse distributions within a barrel column. (A) Semicoronal view of 3D cell type–specific synapse distributions determined by structural overlap between ∼15 000 excitatory dendrites and 285 VPM axons. (B) Cell type–specific 1D VPM synapse profiles along the vertical column axis. L5tt and L6ct pyramids show bimodal profiles of VPM synapses.
Figure 7.
Figure 7.
The number and subcellular distribution of VPM synapses is cell type– and location-specific. (A) VPM innervation respects the border between L2 and L3 resulting in location-specific numbers and innervation patterns of L3 neurons along the vertical column axis. L3 pyramids close to L2 have synaptic contacts mostly within their lower basal dendrites, while L3 pyramids display more homogeneous innervation patterns of the basal and apical oblique dendrites. (B) Averaging across all L3 neurons (aligned by their somata) results in an innervation pattern that is asymmetric, suggesting that all L3 neurons receive VPM input within their lower basal dendrites. (C) For most cell types, the number of synaptic VPM contacts per neuron depends on its soma location along the vertical column axis. (D) The number of synaptic contacts between VPM and excitatory neurons in L4 decreases with increasing distance between the soma and the BCC. L4ss neurons at the BCC display symmetric dendrite patterns. L4ss cells at the column border have polarized dendrites pointing toward the barrel center. In combination with higher VPM innervation at the BCC, the number and innervation patterns of VPM synapses are location specific along the tangential column axis. (E) Averaging across all L4ss neurons results in a radial symmetric innervation pattern, which conceals location-specific profiles. (F) The number of VPM synapses per neuron decreases with the distance from the soma to the BCC for all cell types. Neurons were binned in radial rings of 50,100,150,196.3 (BC border) and 250-μm radius centered on the BCC.
Figure 8.
Figure 8.
Cell type–specific spiking of individual neurons during different behavioral states. (A) Left panel: Vertical locations of all reconstructed somata. Center panel: spontaneous spiking in the anesthetized state. Right panel: evoked spiking (i.e., difference to spontaneous activity), 0–50 ms after passive touch. (B) Left panel: Vertical locations of somata (closed circles mark anatomically identified cells; open circles mark cells assigned by depth and spontaneous spiking). Center panel: Spontaneous spiking activity in awake state. Right panel: Spiking activity during free whisking.
Figure 9.
Figure 9.
Cell type–specific structure–function relationships during different behavioral states. (A) Significant correlation between cell type–specific dendrite length and spontaneous spiking in the anesthetized state at single neuron level. (B) The cell type–specific evoked spiking (0–50 ms after passive touch) displays significant correlations with the number of VPM synapses at single neuron level. (C) Evoked spiking after passive touch displays high correlations for some cell types (e.g., L4ss and L6cc). Spiking in the remaining cell types is uncorrelated to the number of VPM synapses (e.g., L5st and L5tt). (D) Left panel: Significant (Bonferroni corrected) correlation between average cell type–specific dendrite length and average spontaneous spiking. Right panel: Significant correlation between average spontaneous spiking in awake animals and average dendrite length. (E) Left panel: The average cell type–specific evoked spiking (0–50 ms after passive touch) displays significant correlations with the average number of VPM synapses. Right panel: No significant correlation exists between the average numbers of VPM synapses and average spiking during free-whisking. All values in panels D and E are normalized to maximal mean + SD.

Similar articles

Cited by

References

    1. Ankerst M, Breunig M, Kriegel HP, Sander J. In: Delis A, Faloutsous C, Ghandeharizadeh S, editors. ACM SIGMOD’99 International Conference on Management of Data; Philadelphia. 1999. OPTICS: ordering points to identify the clustering structure. (PA): ACM Press. p. 49–60.
    1. Binzegger T, Douglas RJ, Martin KA. A quantitative map of the circuit of cat primary visual cortex. J Neurosci. 2004;24:8441–8453. - PMC - PubMed
    1. Bock DD, Lee WC, Kerlin AM, Andermann ML, Hood G, Wetzel AW, Yurgenson S, Soucy ER, Kim HS, Reid RC. Network anatomy and in vivo physiology of visual cortical neurons. Nature. 2011;471:177–182. - PMC - PubMed
    1. Boudewijns ZS, Kleele T, Mansvelder HD, Sakmann B, de Kock CP, Oberlaender M. Semi-automated three-dimensional reconstructions of individual neurons reveal cell type-specific circuits in cortex. Commun Integr Biol. 2011;4:486–488. - PMC - PubMed
    1. Brecht M, Roth A, Sakmann B. Dynamic receptive fields of reconstructed pyramidal cells in layers 3 and 2 of rat somatosensory barrel cortex. J Physiol. 2003;553:243–265. - PMC - PubMed

Publication types